The Plextor M8Pe (512GB) SSD Review
by Billy Tallis on December 14, 2016 9:00 AM ESTPerformance Consistency
Our performance consistency test explores the extent to which a drive can reliably sustain performance during a long-duration random write test. Specifications for consumer drives typically list peak performance numbers only attainable in ideal conditions. The performance in a worst-case scenario can be drastically different as over the course of a long test drives can run out of spare area, have to start performing garbage collection, and sometimes even reach power or thermal limits.
In addition to an overall decline in performance, a long test can show patterns in how performance varies on shorter timescales. Some drives will exhibit very little variance in performance from second to second, while others will show massive drops in performance during each garbage collection cycle but otherwise maintain good performance, and others show constantly wide variance. If a drive periodically slows to hard drive levels of performance, it may feel slow to use even if its overall average performance is very high.
To maximally stress the drive's controller and force it to perform garbage collection and wear leveling, this test conducts 4kB random writes with a queue depth of 32. The drive is filled before the start of the test, and the test duration is one hour. Any spare area will be exhausted early in the test and by the end of the hour even the largest drives with the most overprovisioning will have reached a steady state. We use the last 400 seconds of the test to score the drive both on steady-state average writes per second and on its performance divided by the standard deviation.
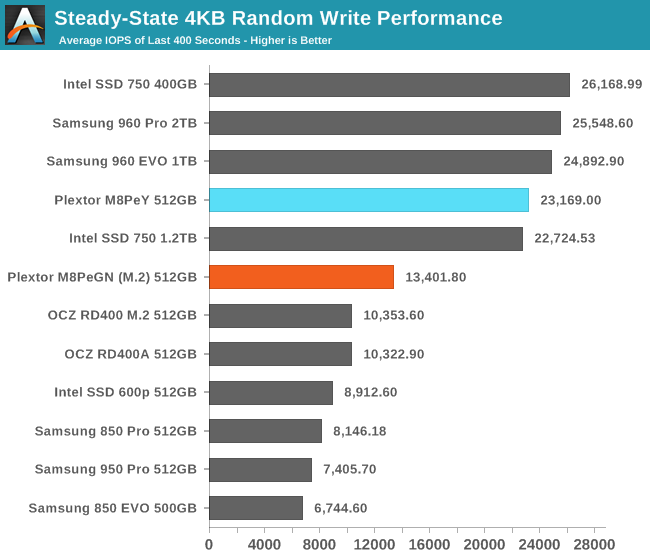
The heatsink makes a huge difference in the sustained random write performance of the M8Pe. With the heatsink, the M8Pe is competitive with the Intel 750 and the Samsung 960 Pro and EVO. Without the heatsink, the M8Pe is slower by almost 10k IOPS, but still above average for consumer SSDs, including some of the NVMe competition.
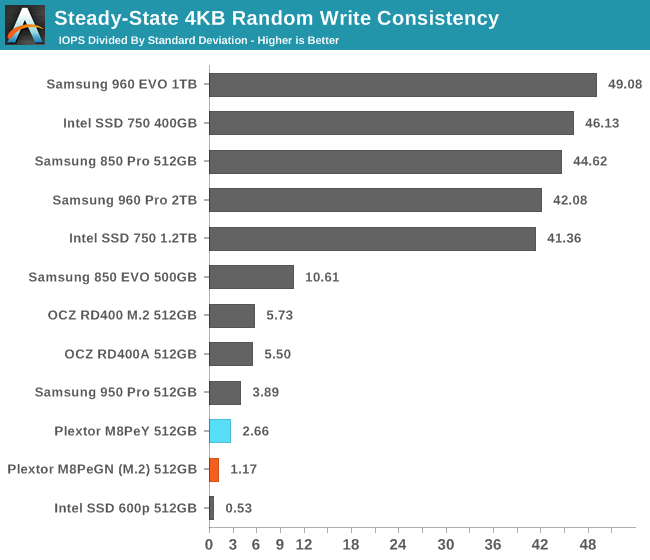
The M8Pe's consistency scores are quite low, indicating that it lacks the tight regulation of Samsung and Intel's best drives that have similar average performance.
 |
|||||||||
| Default | |||||||||
| 25% Over-Provisioning | |||||||||
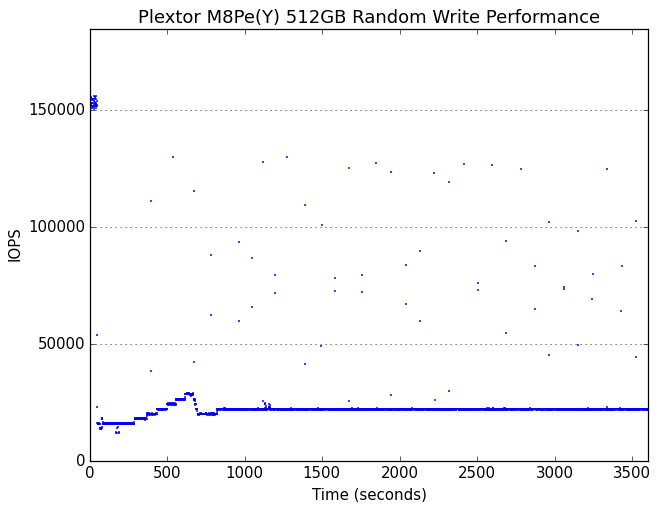
The second by second performance plot reveals that the apparently low consistency is on the M8PeY due entirely to occasional outliers of extremely high performance; most of the time the M8PeY is operating at a very consistent ~22k IOPS, and none of the outliers fall below that level. The M8PeGN without a heatsink or heatspreader suffers from frequent periods of thermal throttling and slightly lower performance when not throttled. The lower performance also causes the M8PeGN to take slightly longer to reach steady state.
 |
|||||||||
| Default | |||||||||
| 25% Over-Provisioning | |||||||||
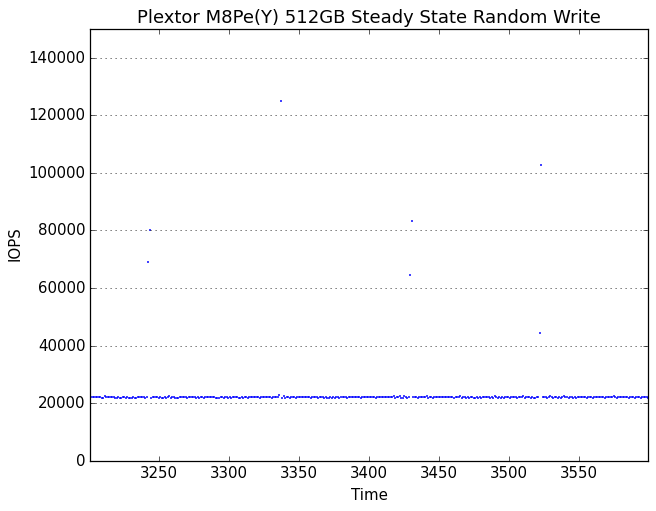
With a heatsink, the M8Pe's steady state hovers around 22k IOPS, but without the heatsink it alternates between 18k IOPS and a thermally throttled 2400 IOPS. Fortunately, it spends more time in the high-performance state than the low performance state, and there are still a few of the extreme outliers above 100k IOPS.
The M8Pe responds very well to extra overprovisioning. The variability is increased slightly, but the performance with the heatsink jumps to 90-100k IOPS sustained. Without a heatsink, the steady state only increases to 60-65k IOPS, but the drive spends much less time thermally throttled and the performance in that state increases to about 6800 IOPS. It's no surprise that the Marvell 88SS1093 controller has been a popular choice for enterprise M.2 PCIe SSDs.


64 Comments
View All Comments
DigitalFreak - Thursday, December 15, 2016 - link
Bullwinkle was actually a bit retarded, so the username fits.Bullwinkle J Moose - Friday, December 16, 2016 - link
My dear Mr Freak,I test actual numbers with a consistent hardware/software combination
If I get new hardware and software and the results for a specific SSD change by 1.7%, I can correct for the the new hardware/software for ALL of the SSD's tested without running new tests
With Synthetic benchmarks we cannot guarantee the accuracy between tests but more importantly the consistency between tests whenever you change test machines with different hardware/software/driver combo's
I can correct my results for different hardware and get reliably consistent results
You Cannot!
So you call ME the Retard?
You just don't get what it is that you just don't get
Meteor2 - Friday, December 16, 2016 - link
Watch your mouth. Until then, people won't respect you.BrokenCrayons - Friday, December 16, 2016 - link
"With Synthetic benchmarks we cannot guarantee..."Just like you've done in the past, you're advocating a controversial position you know will generate responses so you can get attention. Even if it's negative attention, you're still seeking it out.
MrSpadge - Thursday, December 15, 2016 - link
http://www.anandtech.com/show/10909/the-plextor-m8...1. Sequential read, QD1: 1500 MB/s
2. Sequential write, QD1: 1100 MB/s
http://www.anandtech.com/show/10909/the-plextor-m8...
3. Mixed sequential transfers, 50:50 distribution, QD1: 450 MB/s
Bullwinkle J Moose - Thursday, December 15, 2016 - link
MrSpadgeCan you show how these Synthetic Benchmarks relate to actual timed file transfers for accuracy?
If not, you are zero for three as well
Try comparing ACTUAL TIMED TRANSFERS for the copy/paste test I outlined on ANY SSD you currently own and compare it to the results given for synthetic results at this site!
Are they consistently repeatable and reliable?
How far off are they?
ZERO FOR THREE!
NEXT!
BrokenCrayons - Thursday, December 15, 2016 - link
I see you're trying to boost your self-esteem by attempting to discredit someone that tried to help you.Bullwinkle J Moose - Thursday, December 15, 2016 - link
Simply repeating incorrect numbers from a synthetic benchmark is no help to anyoneIf you want to at least make the numbers sound believable, try
1483.8 MB/s read
1136.9 MB/s write
437.2 MB/s mixed
not 1500 / 1100 / 450
still wrong but more believable
ZERO FOR THREE!
MrSpadge - Thursday, December 15, 2016 - link
By insisting on "TIMED TRANSFERS", do you imply this would be a better than reporting the average throughput? Keep in mind that determining the throughput requires a time measurement. the result is just normalized to the amount of transfered data to make it universally useful (not everyone is interested in monolithic 100 GB files).And you talk a lot about accuracy and repeatability. Well, I suspect the benchmarks from AT are just that. However, what is not accurate and repeatable is if I do just what you said: take any random computer and run that copy test. Things influencing such a test, to a varying degree:
- software used for copying
- filling state of the SSD
- wear of the NAND
- interface version used (SATA2?)
- mainboard: controller hardware & firmware
- OS
- storage driver
- additional caching software
- background activity (e.g. how many tabs are open in the browser? how is the add blocker configured?)
This list is not complete, of course. So when is a test meaningful, real world and simple enough for you? When it matches your system in each of those points? Then you won't find a single satisfying review on the web, unless you create it yourself. But be aware that your results won't apply directly to others, so people will complain that you tested in a strange way.
Bullwinkle J Moose - Thursday, December 15, 2016 - link
Quote: By insisting on "TIMED TRANSFERS", do you imply this would be a better than reporting the average throughput?---------------------------------
If I time the transfer of 100GB in 66.66 seconds, I get 1500MB/sec average throughput so not
sure of your point there
1GB / 10GB / 100GB or whatever, as long as the same value is used between drives under test to get a valid comparison between drives on the same hardware + Software (No additional Caching)
The rest of your argument is valid, You may pass!
Synthetic testing may be fine for you but the numbers are meaningless for me
Go with whatever works for you