HiSilicon Kirin 960: A Closer Look at Performance and Power
by Matt Humrick on March 14, 2017 7:00 AM EST- Posted in
- Smartphones
- Mobile
- SoCs
- HiSilicon
- Cortex A73
- Kirin 960
GPU Power Consumption and Thermal Stability
GPU Power Consumption
The Kirin 960 adopts ARM’s latest Mali-G71 GPU, and unlike previous Kirin SoCs that tried to balance performance and power consumption by using fewer GPU cores, the 960’s 8 cores show a clear focus on increasing peak performance. More cores also means more power and raises concerns about sustained performance.
We measure GPU power consumption using a method that’s similar to what we use for the CPU. Running the GFXBench Manhattan 3.1 and T-Rex performance tests offscreen, we calculate the system load power by subtracting the device’s idle power from its total active power while running each test, using each device’s onboard fuel gauge to collect data.
| GFXBench Manhattan 3.1 Offscreen Power Efficiency (System Load Power) |
||||
| Mfc. Process | FPS | Avg. Power (W) |
Perf/W Efficiency |
|
| LeEco Le Pro3 (Snapdragon 821) | 14LPP | 33.04 | 4.18 | 7.90 fps/W |
| Galaxy S7 (Snapdragon 820) | 14LPP | 30.98 | 3.98 | 7.78 fps/W |
| Xiaomi Redmi Note 3 (Snapdragon 650) |
28HPm | 9.93 | 2.17 | 4.58 fps/W |
| Meizu PRO 6 (Helio X25) | 20Soc | 9.42 | 2.19 | 4.30 fps/W |
| Meizu PRO 5 (Exynos 7420) | 14LPE | 14.45 | 3.47 | 4.16 fps/W |
| Nexus 6P (Snapdragon 810 v2.1) | 20Soc | 21.94 | 5.44 | 4.03 fps/W |
| Huawei Mate 8 (Kirin 950) | 16FF+ | 10.37 | 2.75 | 3.77 fps/W |
| Huawei Mate 9 (Kirin 960) | 16FFC | 32.49 | 8.63 | 3.77 fps/W |
| Galaxy S6 (Exynos 7420) | 14LPE | 16.62 | 4.63 | 3.59 fps/W |
| Huawei P9 (Kirin 955) | 16FF+ | 10.59 | 2.98 | 3.55 fps/W |
The Mate 9’s 8.63W average is easily the highest of the group and simply unacceptable for an SoC targeted at smartphones. With the GPU consuming so much power, it’s basically impossible for the GPU and even a single A73 CPU core to run at their highest operating points at the same time without exceeding a 10W TDP, a value more suitable for a large tablet. The Mate 9 allows its GPU to hit 1037MHz too, which is a little silly. For comparison, the Exynos 7420 on Samsung’s 14LPE FinFET process, which also has an 8 core Mali GPU (albeit an older Mali-T760), only goes up to 772MHz, keeping its average power below 5W.
The Mate 9’s average power is 3.1x higher than the Mate 8’s, but because peak performance goes up by the same amount, efficiency turns out to be equal. Qualcomm’s Adreno 530 GPU in Snapdragon 820/821 is easily the most efficient with this workload, and despite achieving about the same performance of Kirin 960, it uses less than half the power.
| GFXBench T-Rex Offscreen Power Efficiency (System Load Power) |
||||
| Mfc. Process | FPS | Avg. Power (W) |
Perf/W Efficiency |
|
| LeEco Le Pro3 (Snapdragon 821) | 14LPP | 94.97 | 3.91 | 24.26 fps/W |
| Galaxy S7 (Snapdragon 820) | 14LPP | 90.59 | 4.18 | 21.67 fps/W |
| Galaxy S7 (Exynos 8890) | 14LPP | 87.00 | 4.70 | 18.51 fps/W |
| Xiaomi Mi5 Pro (Snapdragon 820) | 14LPP | 91.00 | 5.03 | 18.20 fps/W |
| Apple iPhone 6s Plus (A9) [OpenGL] | 16FF+ | 79.40 | 4.91 | 16.14 fps/W |
| Xiaomi Redmi Note 3 (Snapdragon 650) |
28HPm | 34.43 | 2.26 | 15.23 fps/W |
| Meizu PRO 5 (Exynos 7420) | 14LPE | 55.67 | 3.83 | 14.54 fps/W |
| Xiaomi Mi Note Pro (Snapdragon 810 v2.1) |
20Soc | 57.60 | 4.40 | 13.11 fps/W |
| Nexus 6P (Snapdragon 810 v2.1) | 20Soc | 58.97 | 4.70 | 12.54 fps/W |
| Galaxy S6 (Exynos 7420) | 14LPE | 58.07 | 4.79 | 12.12 fps/W |
| Huawei Mate 8 (Kirin 950) | 16FF+ | 41.69 | 3.58 | 11.64 fps/W |
| Meizu PRO 6 (Helio X25) | 20Soc | 32.46 | 2.84 | 11.43 fps/W |
| Huawei P9 (Kirin 955) | 16FF+ | 40.42 | 3.68 | 10.98 fps/W |
| Huawei Mate 9 (Kirin 960) | 16FFC | 99.16 | 9.51 | 10.42 fps/W |
Things only get worse for Kirin 960 in T-Rex, where average power increases to 9.51W and GPU efficiency drops to the lowest value of any device we’ve tested. As another comparison point, the Exynos 8890 in Samsung’s Galaxy S7, which uses a wider 12 core Mali-T880 GPU at up to 650MHz, averages 4.7W and is only 12% slower, making it 78% more efficient.
All of the flagship SoCs we’ve tested from Apple, Qualcomm, and Samsung manage to stay below a 5W ceiling in this test, and even then these SoCs are unable to sustain peak performance for very long before throttling back because of heat buildup. Ideally, we like to see phones remain below 4W in this test, and pushing above 5W just does not make any sense.
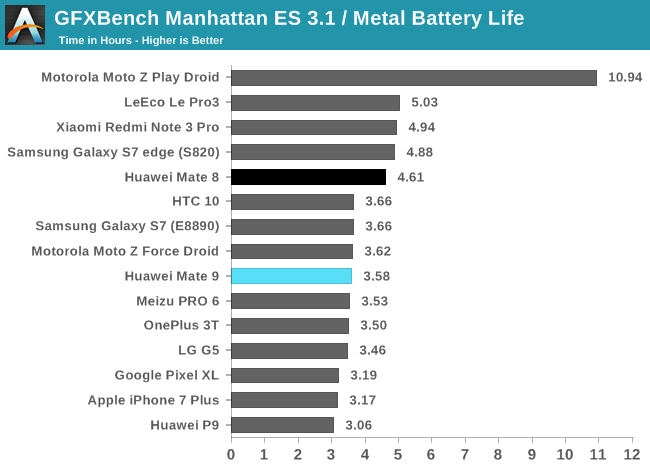
The Kirin 960’s higher power consumption has a negative impact on the Mate 9’s battery life while gaming. It runs for 1 hour less than the Mate 8, a 22% reduction that would be more pronounced it the Mate 9 did not throttle back GPU frequency during the test. Ultimately, the Mate 9’s runtime is similar to other flagship phones (with smaller batteries), while providing similar or better performance. To reconcile Kirin 960’s high GPU power consumption with the Mate 9’s acceptable battery life in our gaming test, we need to look more closely at its behavior over the duration of the test.
GPU Thermal Stability
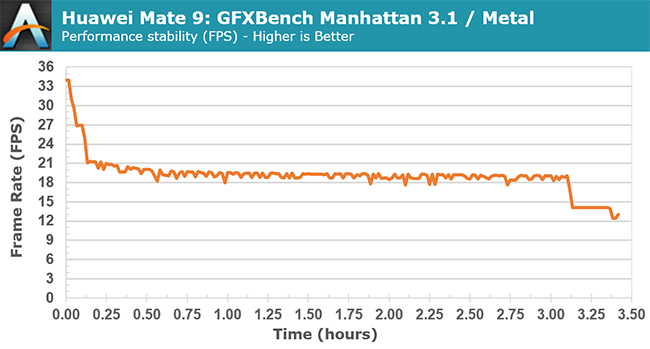
The Mate 9 only maintains peak performance for about 1 minute before reducing GPU frequency, dropping frame rate to 21fps after 8 minutes, a 38% reduction relative to the peak value. It reaches equilibrium after about 30 minutes, with frame rate hovering around 19fps, which is still better than the phones using Kirin 950/955 that peak at 11.5fps with sustained performance hovering between 9-11fps. It’s also as good as or better than phones using Qualcomm’s Snapdragon 820/821 SoCs. The Moto Z Force Droid, for example, can sustain a peak performance of almost 18fps for 12 minutes, gradually reaching a steady-state frame rate of 14.5fps, and the LeEco Pro 3 sustains 19fps after dropping from a peak value of 33fps.
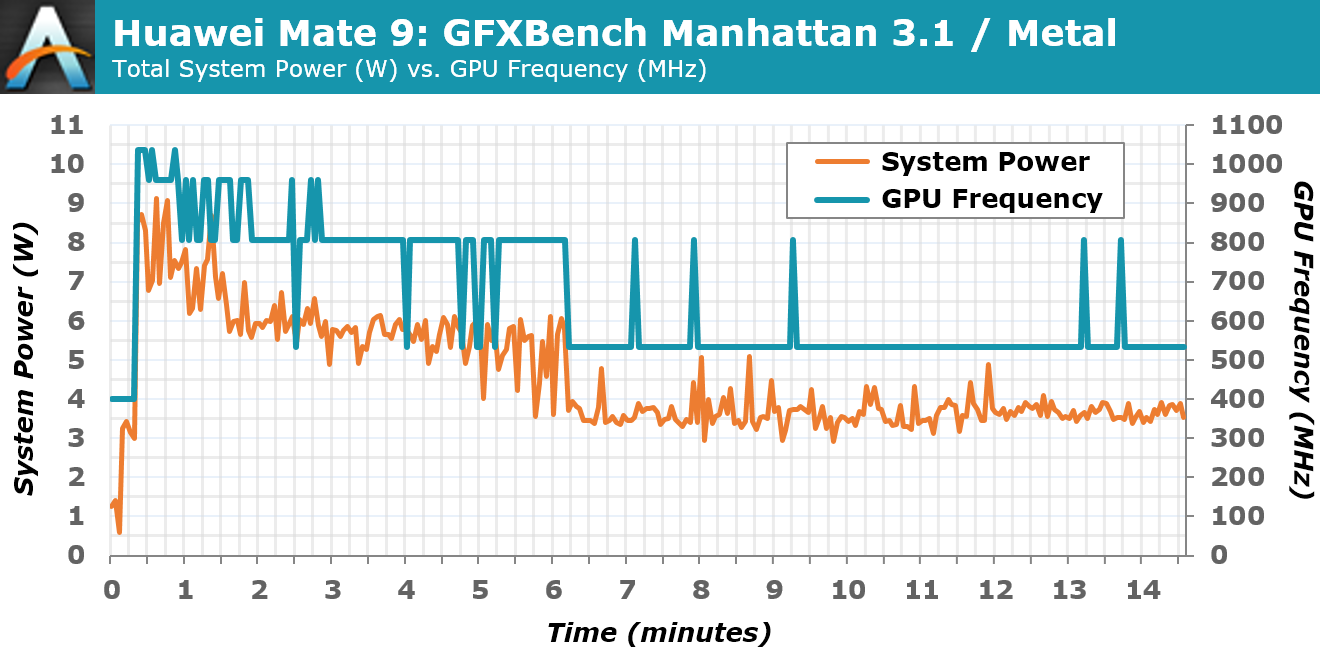
In the lower chart, which shows how the Mate 9’s GPU frequency and power consumption change during the first 15 minutes of the gaming battery test, we can see that once GPU frequency drops to 533MHz, average power consumption drops below 4W, a sustainable value that still results in performance on par with other flagship SoCs after they’ve throttled back too. This suggests that Huawei/HiSilicon should have chosen a more sensible peak operating point for Kirin 960’s GPU of 650MHz to 700MHz. The only reason to push GPU frequency to 1037MHz (at least in a phone or tablet) is to make the device look better on a spec sheet and post higher peak scores in benchmarks.
Lowering GPU frequency would not improve Kirin 960’s low GPU efficiency, however. Because we do not have any other Mali-G71 examples at this time, we cannot say if this is indicative of ARM’s new GPU microarchitecture (I suspect not) or the result of HiSilicon’s implementation and process choice.


86 Comments
View All Comments
MajGenRelativity - Tuesday, March 14, 2017 - link
I'm a dunce sometimes. I totally missed that. Thank you Ian!fanofanand - Tuesday, March 14, 2017 - link
I love that you have begun moderating (to a degree) the comments section! It's nice to have someone with so much knowledge there to dispel the FUD! Not saying his question was bad, but I really do like that you are getting in the mud with us plebs :)MajGenRelativity - Tuesday, March 14, 2017 - link
My question wasn't bad, just stupid :P Should have read that page a little more closely.fanofanand - Tuesday, March 14, 2017 - link
I didn't mean to imply your question was bad at all, and I certainly wasn't lumping you in with those spreading FUD, but Ian has become a growing presence in the comments section and I for one like what he's doing. The comments section in nearly every tech article has become ugly, and having a calming, logical, rational presence like Ian only helps to contribute to a more polite atmosphere where disagreement can be had without presuming that the person with an opposing viewpoint is Hitler.MajGenRelativity - Tuesday, March 14, 2017 - link
I thought this was the Internet, where the opposing viewpoint is always Hitler? :Pfanofanand - Tuesday, March 14, 2017 - link
Hitler has become omnipresent, now the Barrista who underfoams your latte must be Hitler!lilmoe - Tuesday, March 14, 2017 - link
Shouldn't this provide you with even more evidence that max frequency workloads are super artificial, and are completely unrepresentative of normal, day-to-day workloads? This further supports my claim in earlier article comments that chip designers are targeting a certain performance target, and optimizing efficiency for that point in particular.I keep saying this over and over (like a broken record at this point), but I do firmly believe that the benchmarking methodology for mobile parts of the entire blogsphere is seriously misleading. You're testing these processors the same way you would normally do for workstation processors. The author even said it himself, but the article contradicts his very statement. I believe further research/investigations should be done as to where that performance target is. It definitely defers from year to year, with different popular app trends, and from OS upgrade to another.
Spec, Geekbench and browser benchmarks, if tested in context of same device, same OS upgrades, are a good indication of what the chip can artificially achieve. But the real test, I believe, is launching a website, using facebook, snapchat, etc., and comparing power draw of various chips, since that's what these chips were designed to run.
There's also the elephant in the room that NO ONE is accounting for when testing and benchmarking, and that's touch input overhead. Most user interaction is through touch. I don't know about iOS, but everyone knows that Android ramps up the clock when the touchscreen detects input to reduce lag and latency. Your browser battery test DO NOT account for that, further reducing its potential credibility as a valid representation of actual usage.
I mention touch input clock ramps in particular because I believe this is the clock speed that OEMs believe it delivers optimal efficiency on the performance curve for a given SoC, at least for the smaller cluster. A better test would be logging the CPU clocks of certain workloads, and taking the average, then calculating the power draw of the CPU on that particular average clock.
This is where I believe Samsung's SoCs shine the most. I believe they deliver the best efficiency for common workloads, evident in the battery life of their devices after normalization of screen size/resolution to battery capacity.
Worth investigating IMO.
fanofanand - Tuesday, March 14, 2017 - link
If you can come up with a methodology where opening snapchat is a repeatable scientific test, send your hypothesis to Ryan, I'm sure he will indulge your fantasy.lilmoe - Tuesday, March 14, 2017 - link
Yea, we all love fantasies. Thing is, in the last couple of paragraphs, Matt literally said that the entirety of the review does not match with the actual real-world performance and battery life of the Mate 9.But sure, go ahead and keep testing mobile devices using these "scientific" conventional anyway, since it makes readers like fanofanand happy.
close - Tuesday, March 14, 2017 - link
That is, of course, an awesome goal. Now imagine the next review the battery life varies between 10 and 18 hours even on the same phone. Now judge for yourself if this kind of result is more useful to determine which phone has a better battery life. Not only is your real world usage vastly different from mine (thus irrelevant) but you yourself can't even get through 2 days with identical battery life or identical usage. If you can't determine one phone's battery life properly how do you plan on comparing that figure to the ones I come up with?If you judged your comment by the same standards you judge the article you wouldn't have posted it. You implicitly admit there's no good way of testing in the manner you suggest (by refusing or being unable to provide a clearly better methodology) but still insisted on posting it. I will join the poster above in asking you to suggest something better. And don't skimp on the details. I'm sure that if you have a reasonable proposal it will be taken into consideration not for your benefit but for all of ours.
Some of these benchmarks try to simulate a sort of average real world usage (a little bit of everything) in a reproducible manner in order to be used in a comparison. That won't be 100% relevant but there is a good overlap and it's the best comparative tool we've got. Your generic suggestion would most likely provide even less relevant figures unless you come up with that better scenario that you insist on keeping to yourself.