The DeepCool Captain 240 EX RGB AIO Cooler Review: Pump it Up, Without the Noise
by E. Fylladitakis on December 14, 2017 9:00 AM EST- Posted in
- Cases/Cooling/PSUs
- AIO
- Deepcool
- Cooler
Testing Methodology
Although the testing of a cooler appears to be a simple task, that could not be much further from the truth. Proper thermal testing cannot be performed with a cooler mounted on a single chip, for multiple reasons. Some of these reasons include the instability of the thermal load and the inability to fully control and or monitor it, as well as the inaccuracy of the chip-integrated sensors. It is also impossible to compare results taken on different chips, let alone entirely different systems, which is a great problem when testing computer coolers, as the hardware changes every several months. Finally, testing a cooler on a typical system prevents the tester from assessing the most vital characteristic of a cooler, its absolute thermal resistance.
The absolute thermal resistance defines the absolute performance of a heatsink by indicating the temperature rise per unit of power, in our case in degrees Celsius per Watt (°C/W). In layman's terms, if the thermal resistance of a heatsink is known, the user can assess the highest possible temperature rise of a chip over ambient by simply multiplying the maximum thermal design power (TDP) rating of the chip with it. Extracting the absolute thermal resistance of a cooler however is no simple task, as the load has to be perfectly even, steady and variable, as the thermal resistance also varies depending on the magnitude of the thermal load. Therefore, even if it would be possible to assess the thermal resistance of a cooler while it is mounted on a working chip, it would not suffice, as a large change of the thermal load can yield much different results.
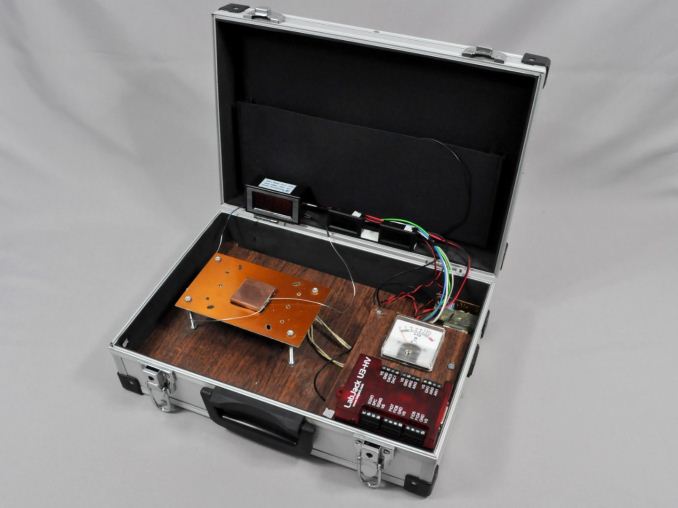
Appropriate thermal testing requires the creation of a proper testing station and the use of laboratory-grade equipment. Therefore, we created a thermal testing platform with a fully controllable thermal energy source that may be used to test any kind of cooler, regardless of its design and or compatibility. The thermal cartridge inside the core of our testing station can have its power adjusted between 60 W and 340 W, in 2 W increments (and it never throttles). Furthermore, monitoring and logging of the testing process via software minimizes the possibility of human errors during testing. A multifunction data acquisition module (DAQ) is responsible for the automatic or the manual control of the testing equipment, the acquisition of the ambient and the in-core temperatures via PT100 sensors, the logging of the test results and the mathematical extraction of performance figures.
Finally, as noise measurements are a bit tricky, their measurement is being performed only manually. Fans can have significant variations in speed from their rated values, thus their actual speed during the thermal testing is being acquired via a laser tachometer. The fans (and pumps, when applicable) are being powered via an adjustable, fanless desktop DC power supply and noise measurements are being taken 1 meter away from the cooler, in a straight line ahead from its fan engine. At this point we should also note that the Decibel scale is logarithmic, which means that roughly every 3 dB(A) the sound pressure doubles. Therefore, the difference of sound pressure between 30 dB(A) and 60 dB(A) is not "twice as much" but nearly a thousand times greater. The table below should help you cross-reference our test results with real-life situations.
The noise floor of our recording equipment is 30.2-30.4 dB(A), which represents a medium-sized room without any active noise sources. All of our acoustic testing takes place during night hours, minimizing the possibility of external disruptions.
| <35dB(A) | Virtually inaudible |
| 35-38dB(A) | Very quiet (whisper-slight humming) |
| 38-40dB(A) | Quiet (relatively comfortable - humming) |
| 40-44dB(A) | Normal (humming noise, above comfortable for a large % of users) |
| 44-47dB(A)* | Loud* (strong aerodynamic noise) |
| 47-50dB(A) | Very loud (strong whining noise) |
| 50-54dB(A) | Extremely loud (painfully distracting for the vast majority of users) |
| >54dB(A) | Intolerable for home/office use, special applications only. |
*noise levels above this are not suggested for daily use


34 Comments
View All Comments
Galid - Thursday, December 14, 2017 - link
By the time you whined about how things should be done, I had two pages opened, I can tell you this: you get lower noise on air coolers in most scenario but delta over ambient on the worst AIO is lower than the best air cooler at 150w load.I would have loved it if there was two relevant air coolers included in these graphs but nothing to write a page about.
bananaforscale - Wednesday, June 20, 2018 - link
You are asking for apples to apples comparisons on coolers with requirements *that aren't the same* (packaging is a huge deal), therefore your logic breaks down.kevbev89 - Thursday, December 14, 2017 - link
I agree with what tricomp and rtfmx9 said... the "apples to apples" reasoning doesn't apply here. From personal experience a ton of people are always asking is water cooling better than air. From a functional standpoint they both serve the same exact purpose.jabber - Thursday, December 14, 2017 - link
I buy AIO coolers mainly because I don't care about getting max cooling efficiency and I think AIO coolers just look far far better than chunks of chrome plated tin in my rig. I'm sure I'm not the only one.Yuriman - Friday, December 15, 2017 - link
I'm sure you're not. I personally have a side panel on my case and can't see the cooler, so effectiveness and price (value) are the factors important to me.SilthDraeth - Thursday, December 14, 2017 - link
I am so glad that you are here to tell your audience that they are wrong and they don't actually want the products compared, despite the numerous comments suggesting and requesting a direct comparison. You must work for Apple. Even though we all ask for the comparison, and believe that they are competing with each other (after all, they serve the same purpose, cooling your system, so I fail to see how you can't correlate that they would be competing for our dollars), yet, we should just forget our own thoughts, and jump on your bandwagon of no need to compare in the review because they are entirely different types of cooling...Then you finish it off with your condescending "the magic of our professional equipment" line, and "you can easily go look up previous reviews the the information you want" attitude. You are the one being payed to write these reviews. Yes a ton of use have used the past data to find things, but it isn't always so clear cut, if you can't remember an exact model name, or as has happened, the data isn't on the site anymore, or is a bear to find.
Seriously, in the past, I remember they used to have a drop down menu with all the reviewed GPU, or CPU and it was easy to find the information. I don't see that anymore, since the site got redesigned.
So get off your high horse, and lose the snarky attitude. I swear, since Purch bought Anandtech the quality and the attitude has stunk.
SilthDraeth - Thursday, December 14, 2017 - link
Ok, I found the the area I was referencing. "Bench" at the top of the site and yes, the cooling data is in there. Though, I would hope the methodology has remained constant.DanNeely - Thursday, December 14, 2017 - link
It probably is. For other tests when methodology changes the benchmark name changes; which is why you've got things like "GPU 2017".PeachNCream - Thursday, December 14, 2017 - link
Air coolers and liquid coolers absolutely are direct competition with one another and I think it's incorrect to state that they're not. It'd be helpful to a number of readers to include a couple of air coolers (maybe the OEM sorts to form a baseline and one or two aftermarket models) without telling your readers to go fish in old articles. :(normadize - Friday, December 15, 2017 - link
A rather disappointing comment, especially coming from AT. You claim testing is repetitive and that we can look at (much) older reviews and trust the numbers are comparable.While you are not exactly an engineer, you could document yourselves a little better. The ambient temperature could not have been exactly the same. You persist in showing delta above ambient in all your reviews, which is an incredibly misleading figure for anyone without an engineering background: temperature does not have a linear dependency with the causing factors (e.g. power draw increases quadratically with frequency, etc) and the same goes for ambient temperature. Heat up your room by 20C and then run the exact same tests and you'll see different delta-over-ambient figures.
You should stop showing delta-over-ambient and instead include ambient temp and device temp in each of your graph. That's far more informative.