Memory Frequency Scaling in SFF Systems: An Investigation with SO-DIMMs and Coffee Lake
by Ganesh T S on November 28, 2018 8:00 AM ESTUL Benchmarks - PCMark and 3DMark
This section deals with a selection of the UL Futuremark benchmarks - PCMark 10, PCMark 8, and 3DMark. While the first two evaluate the system as a whole, 3DMark focuses on the graphics capabilities.
PCMark 10
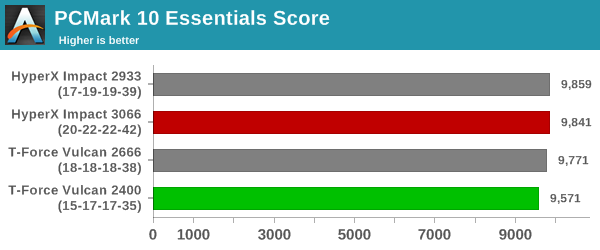
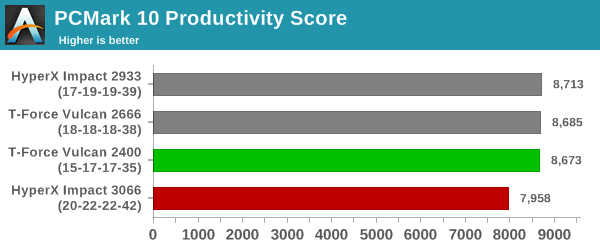
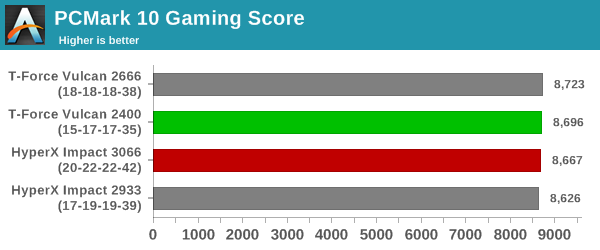
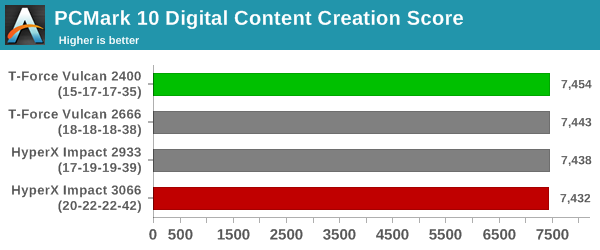
UL's PCMark 10 evaluates computing systems for various usage scenarios (generic / essential tasks such as web browsing and starting up applications, productivity tasks such as editing spreadsheets and documents, gaming, and digital content creation). We benchmarked select PCs with the PCMark 10 Extended profile and recorded the scores for various scenarios. These scores are heavily influenced by the CPU and GPU in the system, though the RAM and storage device also play a part. The power plan was set to Balanced for all the PCs while processing the PCMark 10 benchmark.
The DDR4-2933 seems to perform better than the other configurations in general. However, the scores really don't vary that much across the different configurations for each scenario.

PCMark 8
We continue to present PCMark 8 benchmark results (as those have more comparison points) while our PCMark 10 scores database for systems grows in size. PCMark 8 provides various usage scenarios (home, creative and work) and offers ways to benchmark both baseline (CPU-only) as well as OpenCL accelerated (CPU + GPU) performance. We benchmarked select PCs for the OpenCL accelerated performance in all three usage scenarios. These scores are heavily influenced by the CPU in the system.
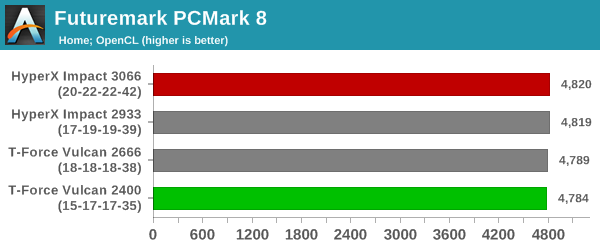
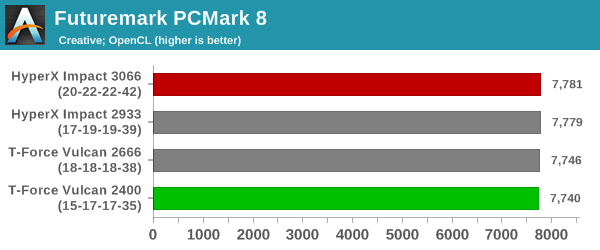
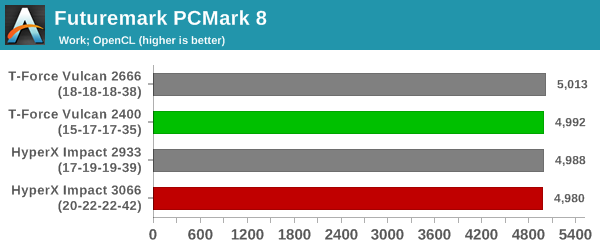
The scores are bunched together for the most part, and a clear delineation between the different configurations is hard to find.
3DMark
UL's 3DMark comes with a diverse set of graphics workloads that target different Direct3D feature levels. Correspondingly, the rendering resolutions are also different. We use 3DMark 2.4.4264 to get an idea of the graphics capabilities of the system. In this section, we take a look at the performance of the ASRock DeskMini Z370 GTX configurations across the different 3DMark workloads.
Since the main system RAM characteristics don't affect GPU-limited workloads, we expect that most benchmark scores are going to be the same for all the tested configurations. There may be some graphics workloads that are CPU / CPU-memory bandwidth limited, but, such characteristics may be hard to target with the GPU-limited 3DMark workloads.
3DMark Ice Storm
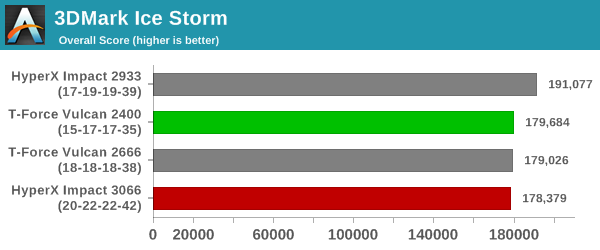
This workload has three levels of varying complexity - the vanilla Ice Storm, Ice Storm Unlimited, and Ice Storm Extreme. It is a cross-platform benchmark (which means that the scores can be compared across different tablets and smartphones as well). All three use DirectX 11 (feature level 9) / OpenGL ES 2.0. While the Extreme renders at 1920 x 1080, the other two render at 1280 x 720. The graphs below present the various Ice Storm workloads' numbers for different configurations that we have evaluated.
| UL 3DMark - Ice Storm Workloads | |||
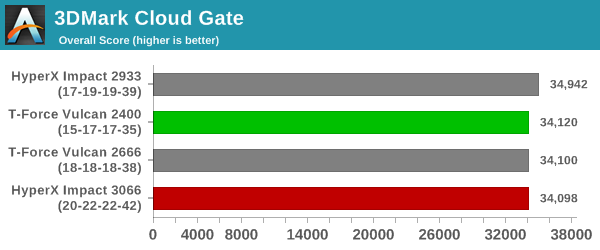
3DMark Cloud Gate
The Cloud Gate workload is meant for notebooks and typical home PCs, and uses DirectX 11 (feature level 10) to render frames at 1280 x 720. The graph below presents the overall score for the workload across all the systems that are being compared.
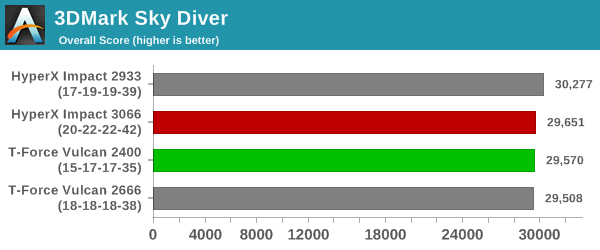
3DMark Sky Diver
The Sky Diver workload is meant for gaming notebooks and mid-range PCs, and uses DirectX 11 (feature level 11) to render frames at 1920 x 1080. The graph below presents the overall score for the workload across all the systems that are being compared.
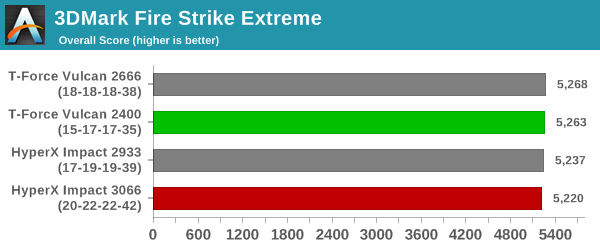
3DMark Fire Strike Extreme
The Fire Strike benchmark has three workloads. The base version is meant for high-performance gaming PCs. Similar to Sky Diver, it uses DirectX 11 (feature level 11) to render frames at 1920 x 1080. The Ultra version targets 4K gaming system, and renders at 3840 x 2160. However, we only deal with the Extreme version in our benchmarking - It renders at 2560 x 1440, and targets multi-GPU systems and overclocked PCs. The graph below presents the overall score for the Fire Strike Extreme benchmark across all the systems that are being compared.
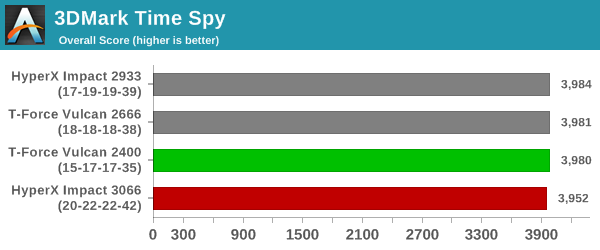
3DMark Time Spy
The Time Spy workload has two levels with different complexities. Both use DirectX 12 (feature level 11). However, the plain version targets high-performance gaming PCs with a 2560 x 1440 render resolution, while the Extreme version renders at 3840 x 2160 resolution. The graphs below present both numbers for all the systems that are being compared in this review.
| UL 3DMark - Time Spy Workloads | |||
3DMark Night Raid
The Night Raid workload is a DirectX 12 benchmark test. It is less demanding than Time Spy, and is optimized for integrated graphics. The graph below presents the overall score in this workload for different system configurations.
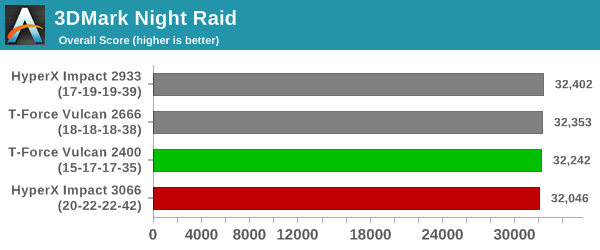
The 'low-end' benchmarks - Sky Diver, Cloud Gate, and Ice Storm - show the DDR4-2933 configuration faring better. These benchmarks represent workloads that the GTX 1060 should have no problem with (they are actually meant for integrated graphics), and the CPU / DRAM characteristics can influence the scores easily. In the GPU-limited cases, we see no variations between the different tested configurations.


25 Comments
View All Comments
cygnus1 - Wednesday, November 28, 2018 - link
How does anyone look at those memory benchmarks and justify buying anything other than the cheapest RAM that meets minimum spec?Yuriman - Wednesday, November 28, 2018 - link
Pretty much agree. Good to know, though.nwrigley - Wednesday, November 28, 2018 - link
Yep. The only difference for me is that I only buy Crucial. This comes from personal experience of AMAZING customer support from them.I had one of their sticks die on me once after 8 years of use. I called in and was shocked to talk to someone in the US. Since they didn't make the same RAM I had anymore, they offered to replace all 4 sticks so that I had a matching set, even though 3 of the 4 sticks were fine. And since the replacements were slower timings without heat spreaders, they offered to double the capacity to cover the difference. They upgraded me from 4x 1-gig sticks of DDR2 to 4x 2-gigs of DDR2 without me raising any fuss - this was all customer services idea. That made me a customer for life.
cygnus1 - Wednesday, November 28, 2018 - link
Yeah, I too am a big Crucial fan because of reasons like this, from my experience as well. Not quite as generous as your story, but never any kind of trouble getting support for their hardware.But these benchmarks really show that performance should not be even remotely near the top of the list of reasons to pick one RAM part over another. Brand/warranty/customer service is a real way to differentiate and justify a given price.
koaschten - Wednesday, November 28, 2018 - link
I found this handy graphic on reddit some time ago:https://i.imgur.com/lbPIkiW.png
Looking at the tested offerings, it is obvious why there was so little performance gain, the Latency/clock relations are just off the chart, for the 3066 CL20 literally.
koaschten - Wednesday, November 28, 2018 - link
source: https://www.reddit.com/r/intel/comments/9mlwbn/ram...yes, this is DIMM not SO-DIMM, but shows the differences nicely.
willis936 - Wednesday, November 28, 2018 - link
It is somewhat frustrating to see all of this work done on a case that doesn't make sense to examine first.If the original question is "When does memory performance matter to CPUs?" then the place to start is at the extreme, not somewhere in the middle. If it was found that an 8 core 4 GHz x86 processor with whatever cache architecture and two channels of memory was memory bandwidth or latency starved THEN it would make sense to start moving down the stack and identify when it is no longer a concern. The conclusion to draw from this is much less meaningful to most any reader. There are like five people on the planet choosing between more expensive and cheaper memory kits for SFF systems.
GreenReaper - Thursday, November 29, 2018 - link
Might make more sense with AMD APUs. You'd probably get a much better return from overclocking the memory than the CPU, given how bandwidth-starved they can be.The_Assimilator - Wednesday, November 28, 2018 - link
Whatever happened to ranking memory by its performance rating, to determine how objectively good it is? For anyone who doesn't know/remember, performance rating = (memory frequency / CAS latency), and higher = better.It's sad that in this day and age, my 2x8GB DDR3-1600 CL8 (with no RGB LEDs or unnecessary heatsinks) has a higher PR than any of these DDR4 kits. It's even sadder that today's reviews of memory that "overclock" it, just concentrate on pushing up the frequency instead of trying to tighten the CAS timings, because the latter is where you'll see the most benefit.
nevcairiel - Wednesday, November 28, 2018 - link
All you are calculating here is the actual latency, since CAS latency is expressed in cycles. What this doesn't account for is the actual memory speed (ie. bandwidth).Just using your formula, a 1600/8 and 3200/16 module should be equal, right? But one of those offers twice the raw memory throughput, at about similar absolute latency (ie. performance rating).
It is a good idea to keep in mind that latency and frequency interact, but not in a way you suggest. Many people look at things like 3200 CL16 and 3600 CL18 and would instinctively say that the second set has a higher latency, while in reality the actual latency is quite similar, and you get more bandwidth.