The $60 CPU Question: AMD Athlon 200GE or Intel Pentium Gold G5400? A Review
by Ian Cutress on January 14, 2019 8:00 AM ESTCPU Performance: Office Tests
The Office test suite is designed to focus around more industry standard tests that focus on office workflows, system meetings, some synthetics, but we also bundle compiler performance in with this section. For users that have to evaluate hardware in general, these are usually the benchmarks that most consider.
All of our benchmark results can also be found in our benchmark engine, Bench.
PCMark 10: Industry Standard System Profiler
Futuremark, now known as UL, has developed benchmarks that have become industry standards for around two decades. The latest complete system test suite is PCMark 10, upgrading over PCMark 8 with updated tests and more OpenCL invested into use cases such as video streaming.
PCMark splits its scores into about 14 different areas, including application startup, web, spreadsheets, photo editing, rendering, video conferencing, and physics. We post all of these numbers in our benchmark database, Bench, however the key metric for the review is the overall score.
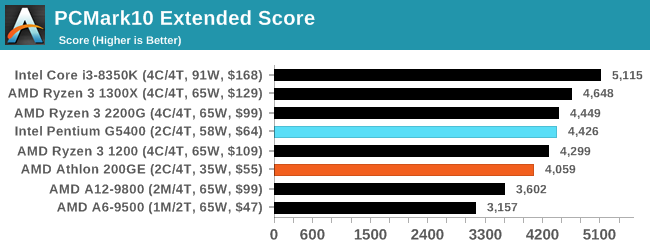
As an all-around test, one hopes that PCMark should be able to shine a light into this analysis. The end result is that PCMark says Intel should be ahead by around 8%.
Chromium Compile: Windows VC++ Compile of Chrome 56
A large number of AnandTech readers are software engineers, looking at how the hardware they use performs. While compiling a Linux kernel is ‘standard’ for the reviewers who often compile, our test is a little more varied – we are using the windows instructions to compile Chrome, specifically a Chrome 56 build from March 2017, as that was when we built the test. Google quite handily gives instructions on how to compile with Windows, along with a 400k file download for the repo.
In our test, using Google’s instructions, we use the MSVC compiler and ninja developer tools to manage the compile. As you may expect, the benchmark is variably threaded, with a mix of DRAM requirements that benefit from faster caches. Data procured in our test is the time taken for the compile, which we convert into compiles per day.
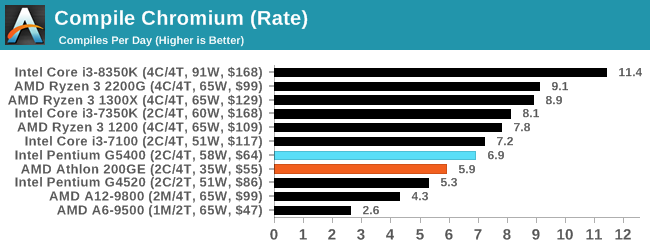
I like this Chromium test, given that it probes a lot of areas within a system. The Intel G5400 wins here again, scoring 6.9 compiles per day, compared to 5.9 for the AMD 200GE.
3DMark Physics: In-Game Physics Compute
Alongside PCMark is 3DMark, Futuremark’s (UL’s) gaming test suite. Each gaming tests consists of one or two GPU heavy scenes, along with a physics test that is indicative of when the test was written and the platform it is aimed at. The main overriding tests, in order of complexity, are Ice Storm, Cloud Gate, Sky Diver, Fire Strike, and Time Spy.
Some of the subtests offer variants, such as Ice Storm Unlimited, which is aimed at mobile platforms with an off-screen rendering, or Fire Strike Ultra which is aimed at high-end 4K systems with lots of the added features turned on. Time Spy also currently has an AVX-512 mode (which we may be using in the future).
For our tests, we report in Bench the results from every physics test, but for the sake of the review we keep it to the most demanding of each scene: Cloud Gate, Sky Diver, Fire Strike Ultra, and Time Spy.
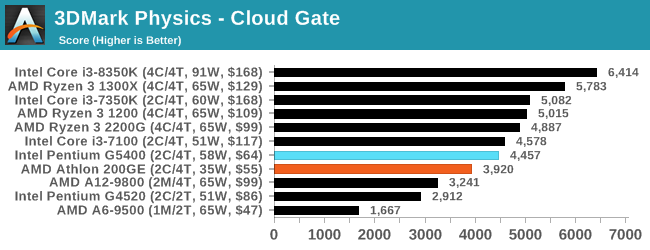
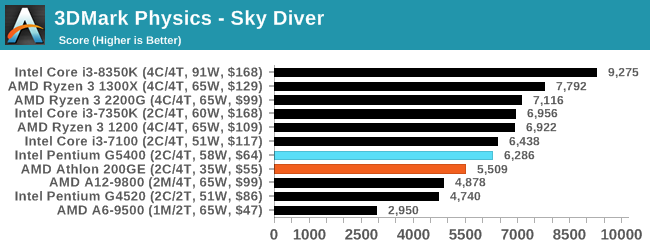
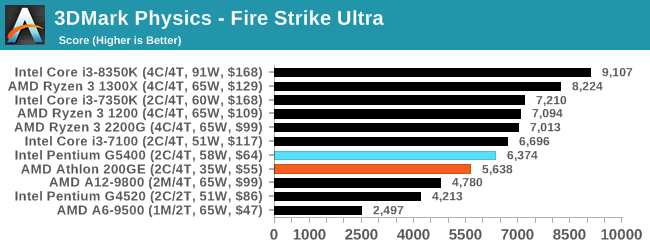
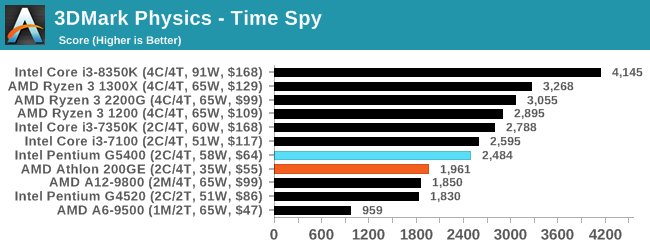
In all the tests except Time Spy, Intel takes an 11-12% lead over AMD, while in Time Spy that increases to 20%.
GeekBench4: Synthetics
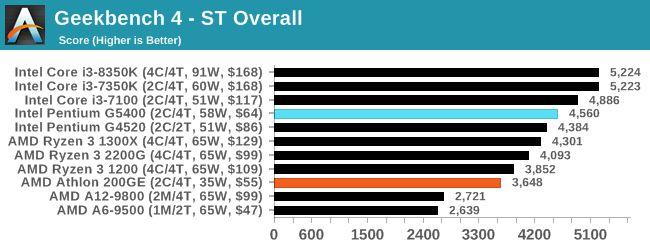
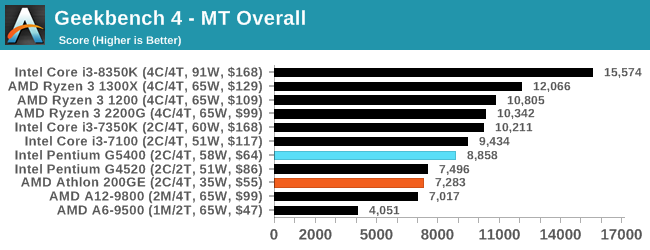
A common tool for cross-platform testing between mobile, PC, and Mac, GeekBench 4 is an ultimate exercise in synthetic testing across a range of algorithms looking for peak throughput. Tests include encryption, compression, fast Fourier transform, memory operations, n-body physics, matrix operations, histogram manipulation, and HTML parsing.
I’m including this test due to popular demand, although the results do come across as overly synthetic, and a lot of users often put a lot of weight behind the test due to the fact that it is compiled across different platforms (although with different compilers).
We record the main subtest scores (Crypto, Integer, Floating Point, Memory) in our benchmark database, but for the review we post the overall single and multi-threaded results.


95 Comments
View All Comments
perdomot - Saturday, January 19, 2019 - link
How does the author of this article not know that the price of the G5400 is in the $120+ range? At that price, the 1300x would be the appropriate comparison and it clearly smokes the Intel cpu in the benches. The author needs a reprimand for this poor work.mito0815 - Thursday, January 24, 2019 - link
Oh ffs. Been a while since I was around, and OH WOULD YOU LOOK AT THAT, the AMD shilling and -fanboyism in the comments has become just as unbearable as I'd imagined. People, he set up two budget CPUs on a comparable level (AMD strong in GPU, Intel a tad bit stronger in CPU performance & clock) against each other...nothing more, nothing less. Store prices for Intel CPU's being so inflated isn't really Intel's fault now, is it? The intended stock prices are still very much comparable. By your logic, AMD would've not been quite the price/performance god you all worship during the mining GPU price explosion now, would it?But no, all you guys want is an article with some AMD CPU coming out on top, no matter how it's done. Get over yourselves. By the looks of it, while GPU is still a sore point with AMD, Ryzen 2 seems to look good so far. Wait for that and don't go all rampant now.
kkilobyte - Saturday, January 26, 2019 - link
The article title starting with: "The $60 CPU question", it is not unreasonable 'fanboi-ism' to expect that the article is comparing CPUs costing, well, around $60.And the issue is not about Intel being guilty or not of the current high prices.
The problem is that the article draws conclusions that simply don't match reality, precisely because it doesn't adress the current discrepancy between the street prices and the manufacturer's suggested one. It would have taken a single paragraph to explain that.
My issue about the article is that, unlike what you are writing, it doesn't compare CPUs of similar (price) level. What it does is comparing CPUs of similar *theorical* price levels, but draws a conclusion as if those were the commonly seen street prices. This is dishonest and misleading.
watersb - Saturday, February 9, 2019 - link
Thanks for this review. I usually build low-end systems (PCs for family members), buy off-lease enterprise stuff (test servers), or used Apple or Lenovo gear (rebuilds and workstation projects).Budget gamng gear for the kids, then help them upgrade graohics card later, seems to be the one remaining path to "gaming enthusiast" hobby.
Everyone else gets a Chromebook. And a Raspberry Pi.
Dr Hasan - Tuesday, November 26, 2019 - link
Why are all products are old and prices too. Athlon 3000g is 50$ rayzen 2200g is less than 100$