The Western Digital WD Blue SN500 SSD Review: Moving The Mainstream To NVMe
by Billy Tallis on April 19, 2019 9:30 AM ESTWhole-Drive Fill
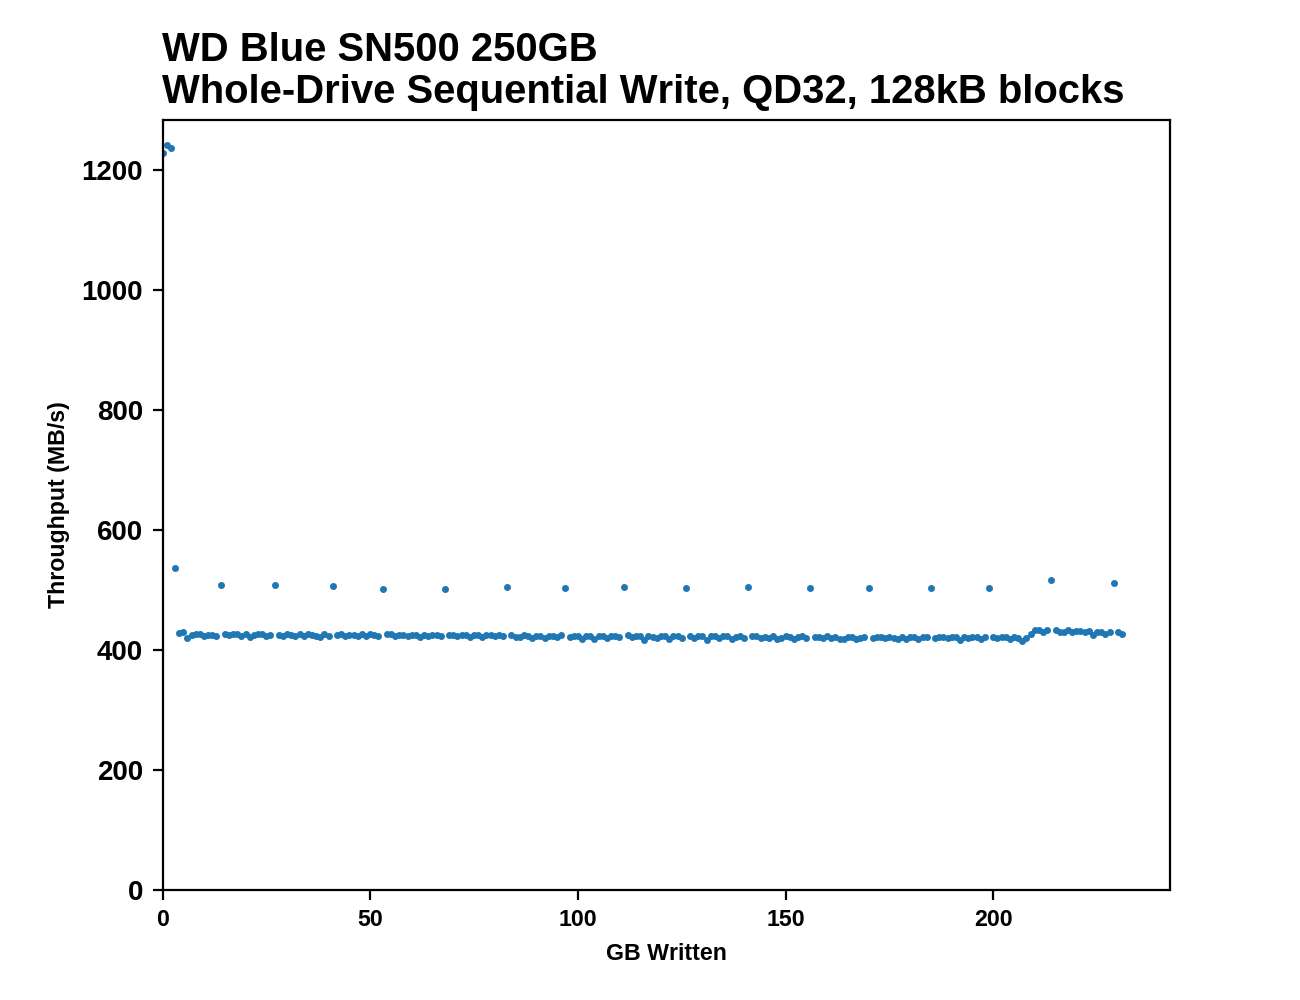
This test starts with a freshly-erased drive and fills it with 128kB sequential writes at queue depth 32, recording the write speed for each 1GB segment. This test is not representative of any ordinary client/consumer usage pattern, but it does allow us to observe transitions in the drive's behavior as it fills up. This can allow us to estimate the size of any SLC write cache, and get a sense for how much performance remains on the rare occasions where real-world usage keeps writing data after filling the cache.
 |
|||||||||
The 250GB WD Blue SN500's SLC write cache lasts for a mere 3GB before the write speed drops down to SATA speeds. After the cache is exhausted, the write speed is very consistent, with periodic short of higher performance that last for less than 1GB.
 |
|||||||||
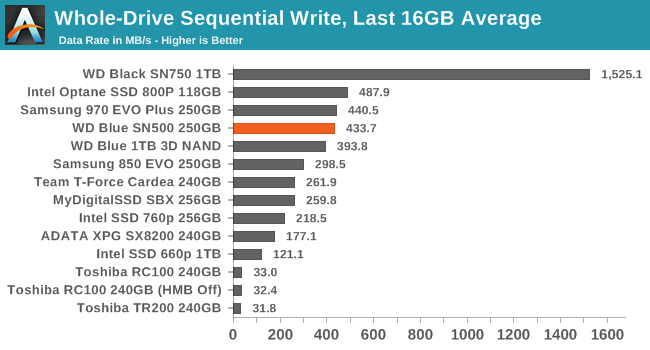
| Average Throughput for last 16 GB | Overall Average Throughput | ||||||||
The SN500's sustained sequential write speed of about 432MB/s doesn't make much use of the speed offered by the PCIe host connection, but it's very good for a drive in this capacity class: the Samsung 970 EVO Plus is barely any faster, though its SLC cache is much larger. None of the other low-end NVMe drives we've tested come close to sustaining the long-term write performance that the SN500 provides.
Working Set Size
Most mainstream SSDs have enough DRAM to store the entire mapping table that translates logical block addresses into physical flash memory addresses. DRAMless drives only have small buffers to cache a portion of this mapping information. When accessing a logical block whose mapping is not cached, the drive needs to read the mapping from the full table stored on the flash memory before it can read the user data stored at that logical block. This adds extra latency to read operations and in the worst case may double random read latency.
We can estimate the size of any on-controller mapping buffer by performing random reads from different sized portions of the drive. When performing random reads from a small slice of the drive, we expect the mappings to all fit in the cache, and when performing random reads from the entire drive, we expect mostly cache misses.
When performing this test on mainstream drives with a full-sized DRAM cache, we expect performance to be generally constant regardless of the working set size, or for performance to drop only slightly as the working set size increases.
 |
|||||||||
The SN500 offers good random read IOPS for working set sizes up to about 4GB before performance begins to decline. Based on the usual ratio of requiring 1MB of mapping data cache per GB of storage, it looks like the SN500's controller devotes around 4MB of SRAM to this purpose. That's significantly smaller than the typical Host Memory Buffer sizes used by DRAMless NVMe SSDs that implement that feature. For example, the Toshiba RC100 uses an HMB of 38MB and maintains random read performance out to at least 24GB working set sizes.
While the SN500's cache of address mapping data may be rather small, it is clearly plenty fast: for small working set sizes, the SN500's random read performance is higher than the WD Black SN750.
BAPCo SYSmark 2018
BAPCo's SYSmark 2018 is an application-based benchmark that uses real-world applications to replay usage patterns of business users, with subscores for productivity, creativity and responsiveness. Scores represnt overall system performance and are calibrated against a reference system that is defined to score 1000 in each of the scenarios. A score of, say, 2000, would imply that the system under test is twice as fast as the reference system.
SYSmark scores are based on total application response time as seen by the user, including not only storage latency but time spent by the processor. This means there's a limit to how much a storage improvement could possibly increase scores, because the SSD is only in use for a small fraction of the total test duration. This is a significant difference from our ATSB tests where only the storage portion of the workload is replicated and disk idle times are cut short to a maximum of 25ms.
| AnandTech SYSmark SSD Testbed | |
| CPU | Intel Core i5-7400 |
| Motherboard | ASUS PRIME Z270-A |
| Chipset | Intel Z270 |
| Memory | 2x 4GB DDR4-2666 CL15 |
| Case | In Win C583 |
| Power Supply | Cooler Master G550M |
| OS | Windows 10 64-bit, version 1803 |
Our SSD testing with SYSmark uses a different test system than the rest of our SSD tests. This machine is set up to measure total system power consumption rather than just the drive's power.
 |
|||||||||
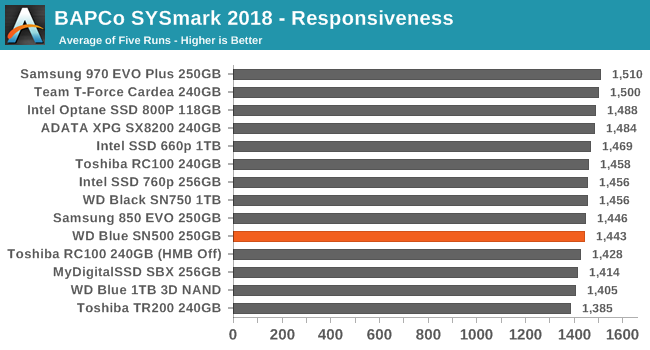
| Creativity | Productivity | Responsiveness | Overall | ||||||
Only the Responsiveness subscore shows a meaningful difference between SSDs of similar capacities, and even then the difference between the top NVMe drives and the slowest DRAMless SATA drives is fairly small. The WD Blue SN500's Responsiveness score is a bit slower than average for this bunch of SSDs, but as more of an entry-level NVMe drive this isn't a disappointment for the SN500.
Energy Usage
The SYSmark energy usage scores measure total system power consumption, excluding the display. Our SYSmark test system idles at around 26 W and peaks at over 60 W measured at the wall during the benchmark run. SATA SSDs seldom exceed 5 W and idle at a fraction of a watt, and the SSDs spend most of the test idle. This means the energy usage scores will inevitably be very close. A typical notebook system will tend to be better optimized for power efficiency than this desktop system, so the SSD would account for a much larger portion of the total and the score difference between SSDs would be more noticeable.
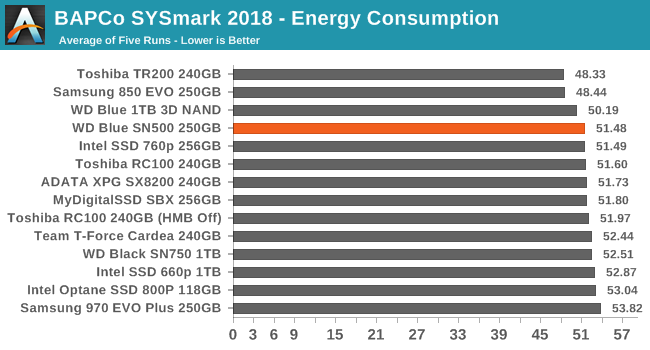
The WD Blue SN500 is one of the most efficient NVMe drives in its capacity class, but the SATA drives still take all the top scores for energy consumption over the course of a SYSmark run. There are several faster NVMe drives that have power requirements only slightly above the SN500 despite including the DRAM cache the SN500 lacks.


50 Comments
View All Comments
gglaw - Saturday, April 20, 2019 - link
There really is no market segment for this drive unless the WD name is enough to sway a lot of customers. Pretty much every week there's an EX920 or Adata 8200 500GB drive for between $70-$80 and they are superior to this drive in every way. You could nitpick on brand reliability, etc, but both those drives have an incredible track record in the last couple years.For a primary OS/Apps drive, I would get the faster HP/Adata for a few bucks more, and for a games/storage drive I would get the cheapest SATA I could find (usually an Adata 1TB for $90). Can't think of any scenario I would get a budget NVME over one of these options. This WD drive would have to drop to $60 to be a real contender.
DyneCorp - Sunday, April 21, 2019 - link
There's absolutely a market.The SN500 will drop in price drastically. It also will stand out when prices increase, as they always do. Just as QLC dropped in price, just as 3D NAND dropped in price.
Why you people have to drop negative comments about a product that was just released, I'll never understand. It always drops in price. First world problems, my son.
By the way, spending "a few bucks more" for an overkill drive makes no sense. The SN500 is more than capable as an OS drive.
Realistically, WD releasing the SN500 provides more competition and that will lower prices. I really don't understand what your issue is.
Cisco Guy 318 - Sunday, April 21, 2019 - link
Abismal endurance! What happened to petabyte endurance? MLC is bad enough but the newer chips have poor endurance!FunBunny2 - Sunday, April 21, 2019 - link
to paraphrase an ancient consultants' adage: "speed, endurance, capacity; choose two".DyneCorp - Sunday, April 21, 2019 - link
Except that 64-layer 3D TLC NAND has exceeded planar MLC in every metric?FunBunny2 - Sunday, April 21, 2019 - link
for now, I suppose. so long as TLC is fabricated on 40-50nm, perhaps so. capitalist greed will, in due time, impel vendors to drop down to contemporary nodes in search of capacity. what then? or, is it, now?Mr Tallis: true of speed and endurance?
DyneCorp - Sunday, April 21, 2019 - link
Except that 64-layer 3D NAND (and up) from Samsung and Micron/ Intel is at 20nm and Toshiba/ Western Digital is at 19nm. You understand planar TLC basically ceased at 14-15nm?Back in 2016, with the advent of smart SLC caching techniques in addition to intelligent controller firmware, SSDs utilizing 3D NAND effectively outpaced 2D "planar" MLC. In fact, the 660p (utilizing 3D QLC) can perform on par (in certain metrics) with SSDs utilizing MLC because of Intel's intelligent pSLC caching strategies.
In the end, it doesn't matter. You'll never chew through the endurance of a modern SSD when subjecting it to consumer workloads, period. The controller can effectively mitigate write amplification in most circumstances.
DyneCorp - Sunday, April 21, 2019 - link
Abysmal endurance? Far from it. The SN500 carries an endurance rating far above the Samsung 850 EVO and is in SU800 territory; its endurance rating is actually quite high, comparatively.You do understand that just about any SSD utilizing 3D NAND has endurance ratings far beyond what 2D planar MLC SSDs had?
Most importantly, remember this: endurance doesn't matter for consumer drives. SSDs last far beyond their warranted endurance life.It's been tested.
Why is this? Because modern controllers can effectively mitigate write amplification by several factors. The majority of consumer workloads will NEVER burn through rated endurance, period. Honestly, including a TBW rating is unnecessary.
PeachNCream - Monday, April 22, 2019 - link
You can expend the write endurance of a modern SSD. It isn't a difficult prospect and workloads don't have to be heavy ones for that to happen.DyneCorp - Monday, April 22, 2019 - link
Under consumer workloads (OS and gaming) no, you cannot. It has been tested. Also, SSDs regularly outlast their given TBW rating by multiple times. If you check the S.M.A.R.T. attributes and software of older planar SSDs you'll see that even heavily utilized SSDs are healthy.