The Intel 12th Gen Core i9-12900K Review: Hybrid Performance Brings Hybrid Complexity
by Dr. Ian Cutress & Andrei Frumusanu on November 4, 2021 9:00 AM ESTPower: P-Core vs E-Core, Win10 vs Win11
For Alder Lake, Intel brings two new things into the mix when we start talking about power.
First is what we’ve already talked about, the new P-core and E-core, each with different levels of performance per watt and targeted at different sorts of workloads. While the P-cores are expected to mimic previous generations of Intel processors, the E-cores should offer an interesting look into how low power operation might work on these systems and in future mobile systems.
The second element is how Intel is describing power. Rather than simply quote a ‘TDP’, or Thermal Design Power, Intel has decided (with much rejoicing) to start putting two numbers next to each processor, one for the base processor power and one for maximum turbo processor power, which we’ll call Base and Turbo. The idea is that the Base power mimics the TDP value we had before – it’s the power at which the all-core base frequency is guaranteed to. The Turbo power indicates the highest power level that should be observed in normal power virus (usually defined as something causing 90-95% of the CPU to continually switch) situation. There is usually a weighted time factor that limits how long a processor can remain in its Turbo state for slowly reeling back, but for the K processors Intel has made that time factor effectively infinite – with the right cooling, these processors should be able to use their Turbo power all day, all week, and all year.
So with that in mind, let’s start simply looking at the individual P-cores and E-cores.
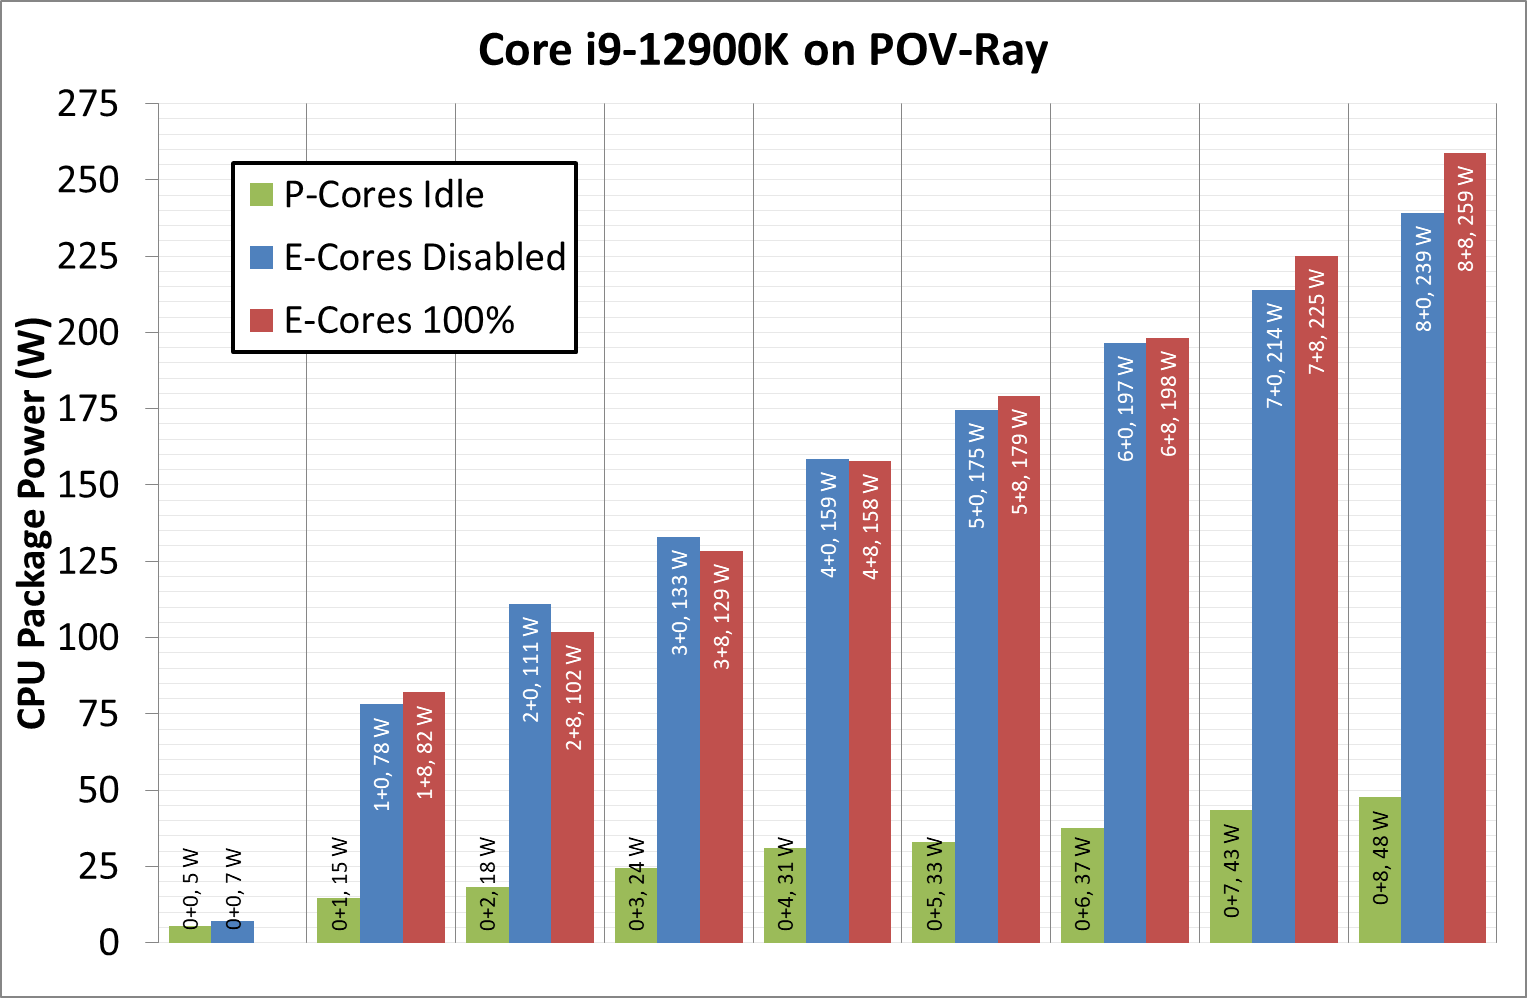
Listed in red, in this test, all 8P+8E cores fully loaded (on DDR5), we get a CPU package power of 259 W. The progression from idle to load is steady, although there is a big jump from idle to single core. When one core is loaded, we go from 7 W to 78 W, which is a big 71 W jump. Because this is package power (the output for core power had some issues), this does include firing up the ring, the L3 cache, and the DRAM controller, but even if that makes 20% of the difference, we’re still looking at ~55-60 W enabled for a single core. By comparison, for our single thread SPEC power testing on Linux, we see a more modest 25-30W per core, which we put down to POV-Ray’s instruction density.
By contrast, in green, the E-cores only jump from 5 W to 15 W when a single core is active, and that is the same number as we see on SPEC power testing. Using all the E-cores, at 3.9 GHz, brings the package power up to 48 W total.
It is worth noting that there are differences between the blue bars (P-cores only) and the red bars (all cores, with E-cores loaded all the time), and that sometimes the blue bar consumes more power than the red bar. Our blue bar tests were done with E-cores disabled in the BIOS, which means that there might be more leeway in balancing a workload across a smaller number of cores, allowing for higher power. However as everything ramps up, the advantage swings the other way it seems. It’s a bit odd to see this behavior.
Moving on to individual testing, and here’s a look at a power trace of POV-Ray in Windows 11:
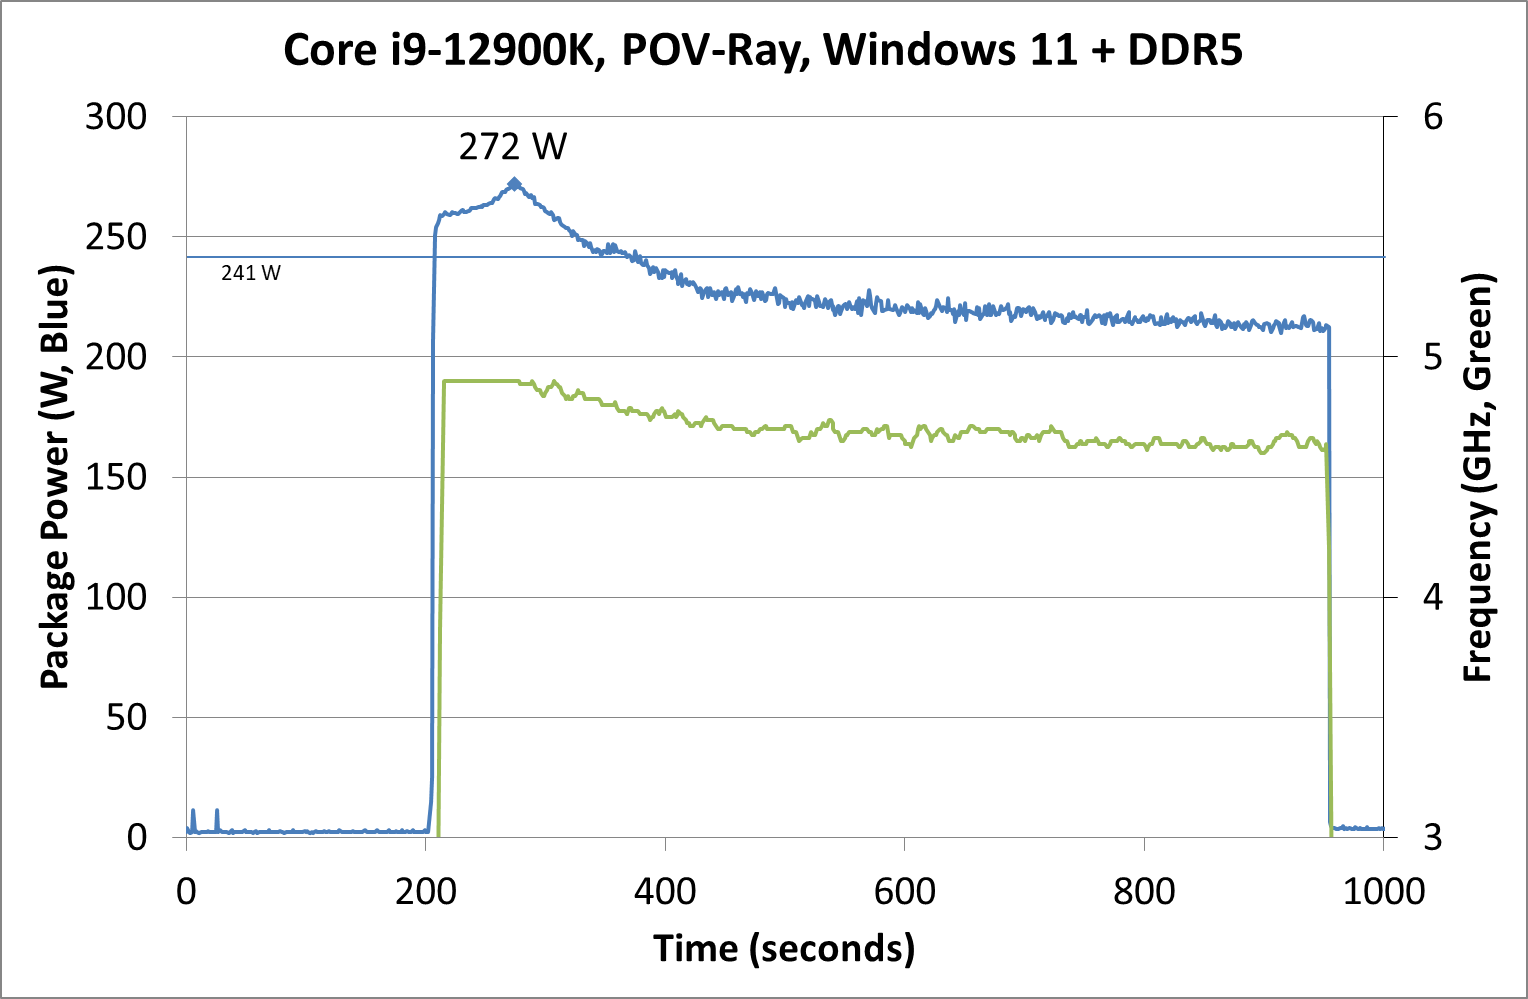
Here we’re seeing a higher spike in power, up to 272 W now, with the system at 4.9 GHz all-core. Interestingly enough, we see a decrease of power through the 241 W Turbo Power limit, and it settles around 225 W, with the reported frequency actually dropping to between 4.7-4.8 GHz instead. Technically this all-core is meant to take into account some of the E-cores, so this might be a case of the workload distributing itself and finding the best performance/power point when it comes to instruction mix, cache mix, and IO requirements. However, it takes a good 3-5 minutes to get there, if that’s the case.
Intrigued by this, I looked at how some of our other tests did between different operating systems. Enter Agisoft:
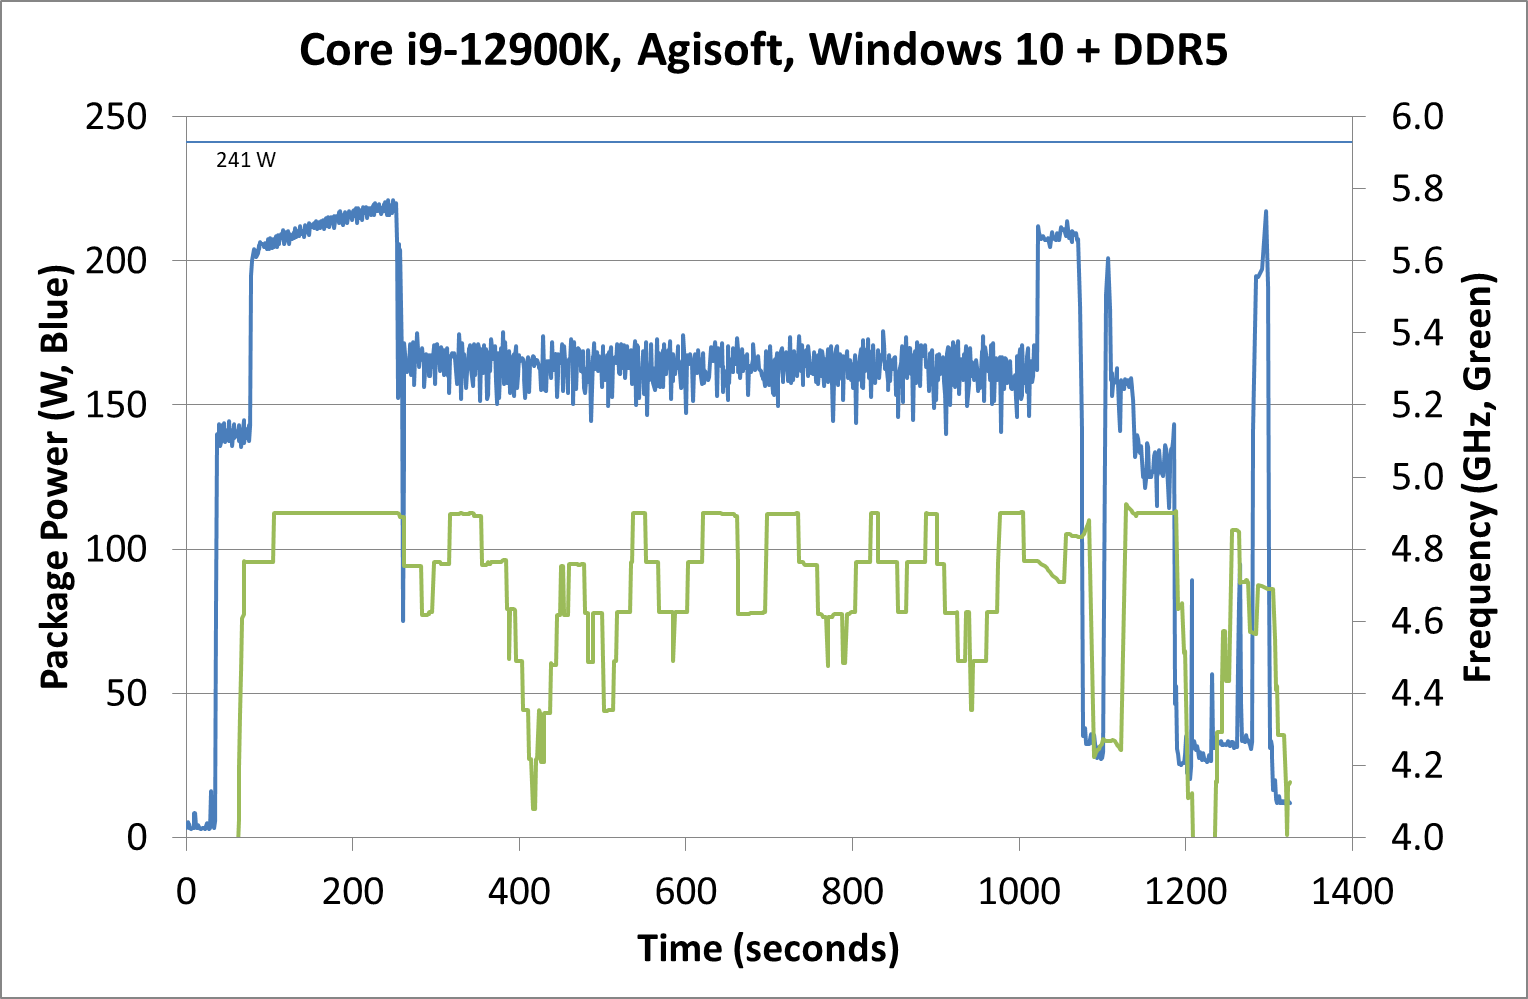
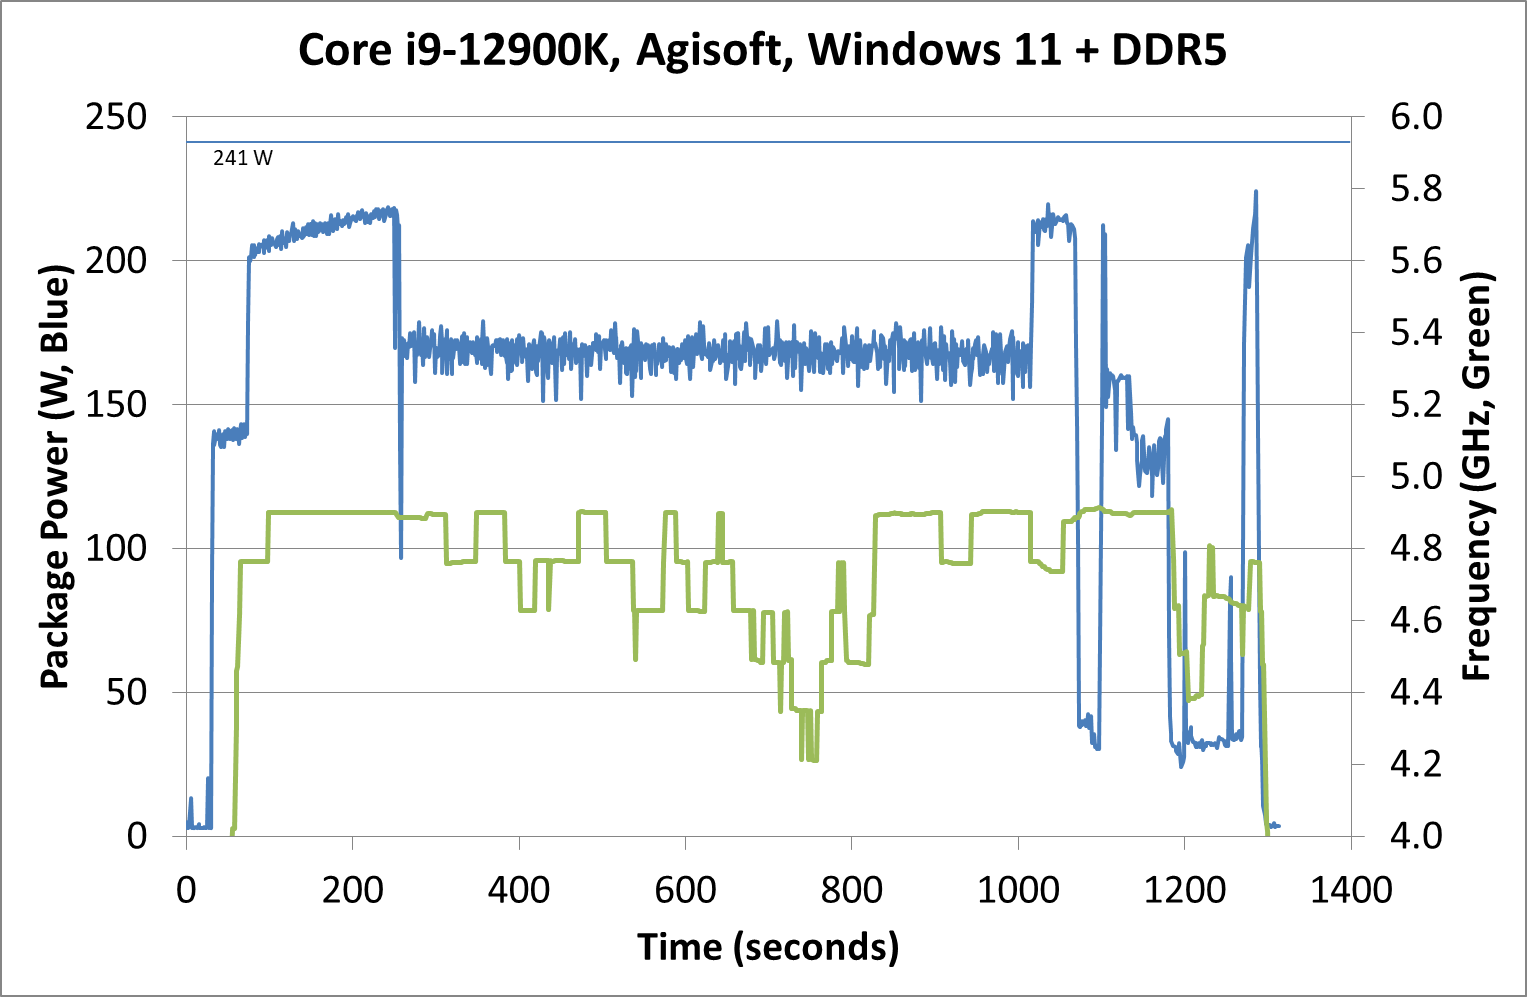
Between Windows 10 and Windows 11, the traces look near identical. The actual run time was 5 seconds faster on Windows 11 out of 20 minutes, so 0.4% faster, which we would consider run-to-run variation. The peaks and spikes look barely higher in Windows 11, and the frequency trace in Windows 11 looks a little more consistent, but overall they’re practically the same.
For our usual power graphs, we get something like this, and we’ll also add in the AVX-512 numbers from that page:
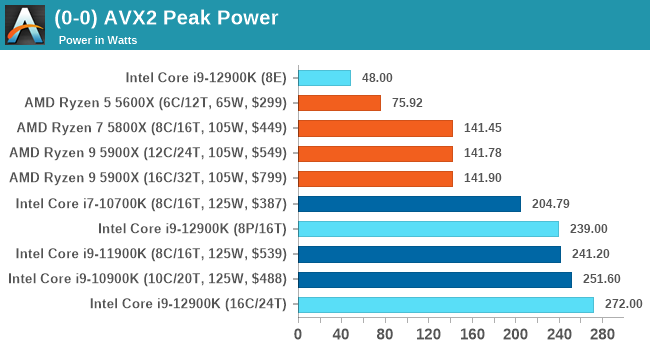
Compared to Intel’s previous 11th Generation Processor, the Alder Lake Core i9 uses more power during AVX2, but is actually lower in AVX-512. The difficulty of presenting this graph in the future is based on those E-cores; they're more efficient, and as you’ll see in the results later. Even on AVX-512, Alder Lake pulls out a performance lead using 50 W fewer than 11th Gen.
When we compare it to AMD however, with that 142 W PPT limit that AMD has, Intel is often trailing at a 20-70 W deficit when we’re looking at full load efficiency. That being said, Intel is likely going to argue that in mixed workloads, such as two software programs running where something is on the E-cores, it wants to be the more efficient design.


474 Comments
View All Comments
ButIDontWantAUsername - Wednesday, November 10, 2021 - link
How's that validation with Denuvo going? Nothing like upgrading to Intel and having your games suddenly start crashing.Iketh - Tuesday, November 30, 2021 - link
please, no more comments from youtuxRoller - Friday, November 5, 2021 - link
Most desktops at enterprise companies could be replaced with terminals given that most of the people are really just performing data entry & retrieval. The network is the bit doing the work.For people who need old school workstations, then I agree, but that's a damn small (but high margin) market.
blanarahul - Thursday, November 4, 2021 - link
Alder Lake is extremely efficient when gaming - https://www.igorslab.de/en/intel-core-i9-12900kf-c...Scroll down and you'll find a graph detailing total gaming power consumption (CPU + GPU) and CPU power consumed per fps. In both metrics, Alder Lake is doing better than Zen 3 and much better than Rocket Lake.
PC World's review - https://www.pcworld.com/article/548999/12th-gen-co... - conveys that while 12900K goes volcanic in Cinebench, it sips power in a real world workload.
It seems like Alder Lake for desktop has been clocked way beyond its performance/watt sweet spot. It should be very interesting to compare Alder Lake for laptops v/s Zen 3 for laptops.
blanarahul - Thursday, November 4, 2021 - link
To give a short summary for (only) CPU power consumption v/s FPS when playing Horizon Zero Dawn11900K consumes 100 watts for 143 fps
5950X consumes 95 watts for 145 fps
5800X consumes 59 watts for 144 fps
12900K consumes 52 watts for 146 fps
12700K consume 43 (!) watts for 145 fps
Intel is very, very competent with AMD. Considering that 12700K has less E cores and consumes less power, I am very curious how it would do with all E cores disabled and running only on P cores.
Netmsm - Thursday, November 4, 2021 - link
Sounds like there is only gaming world!In PCs it may not be considered as a egregious blunder however you're right Intel is now competitive but to previous AMD's if and only if we wink at Intel's guzzling power.
Some examples from Tom's benches:
y-cruncher
12900k DDR5 consumes 197 watts whereas 5950x consumes 103 watts.
handbrake
12900k DDR5 consumes 224 watts whereas 5950x consumes 124 watts.
blender bmw27
12900k DDR5 consumes 205 watts whereas 5950x consumes 125 watts.
Will you calculate power efficiency, please?
geoxile - Thursday, November 4, 2021 - link
My 5950X uses 130-140W in y-cruncher. And @TweakPC on twitter tested lower PL1 and found the 12900k was only around 5% slower using 150W than 218W. Alderlake being power hungry is only because Intel is pushing 8 P-cores and 8 E-cores (collectively equal to around 4 P-cores according to Intel) to the limit, to compete against 16 Zen 3 cores. You can argue that it's still not as good as the 5950X but efficiency in this case is purely a problem of how much power Intel is allowing by defaultflyingpants265 - Thursday, November 4, 2021 - link
Because they need all that extra power to increase their performance a tiny bit. They're not just doing it for fun.Netmsm - Saturday, November 6, 2021 - link
Exactly 👍Netmsm - Thursday, November 4, 2021 - link
Even Ian has "accidentally" forgotten to put nominal TDP for 12900k in results =))All CPUs in "CUP Benchmark Performance: Intel vs AMD" are mentioned with their nominal TDP except 12900k.
It sounds there's some recommendations! How venal!