Akasa AK-ENU3M2-07 USB 3.2 Gen 2x2 SSD Enclosure Review: 20Gbps with Excellent Thermals
by Ganesh T S on August 1, 2022 8:00 AM ESTPerformance Benchmarks
Benchmarks such as ATTO and CrystalDiskMark help provide a quick look at the performance of the direct-attached storage device. The results translate to the instantaneous performance numbers that consumers can expect for specific workloads, but do not account for changes in behavior when the unit is subject to long-term conditioning and/or thermal throttling. Yet another use of these synthetic benchmarks is the ability to gather information regarding support for specific storage device features that affect performance.
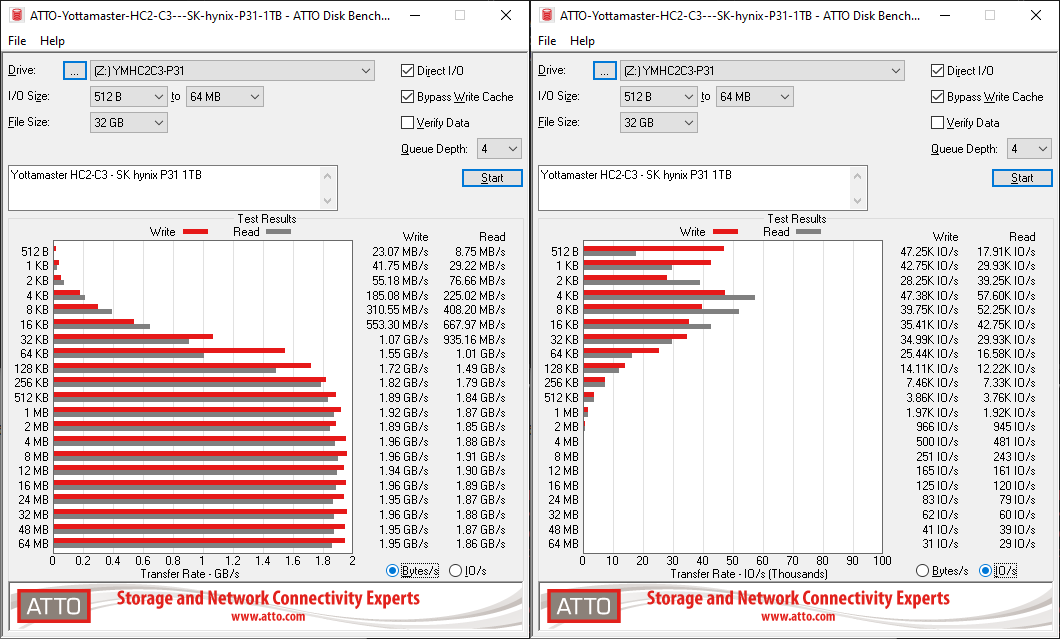
Two key aspects to look into here are whether the storage bridge is able to deliver 2GBps speeds, and whether there are any glaring red flags when compared with other similar storage bridges. In both aspects, we find the AK-ENU3M2-07 giving no cause for concern. The ATTO benchmarks provided below show similar performance for all three enclosures - the Akasa one, the Silverstone MS12, and the Yottamaster HC12. ATTO benchmarking is restricted to a single configuration in terms of queue depth, and is only representative of a small sub-set of real-world workloads. It does allow the visualization of change in transfer rates as the I/O size changes, with optimal performance being reached around 512 KB for a queue depth of 4 - this may vary based on the bridge firmware too.
| ATTO Benchmarks | |
| TOP: | BOTTOM: |
 |
|
 |
|
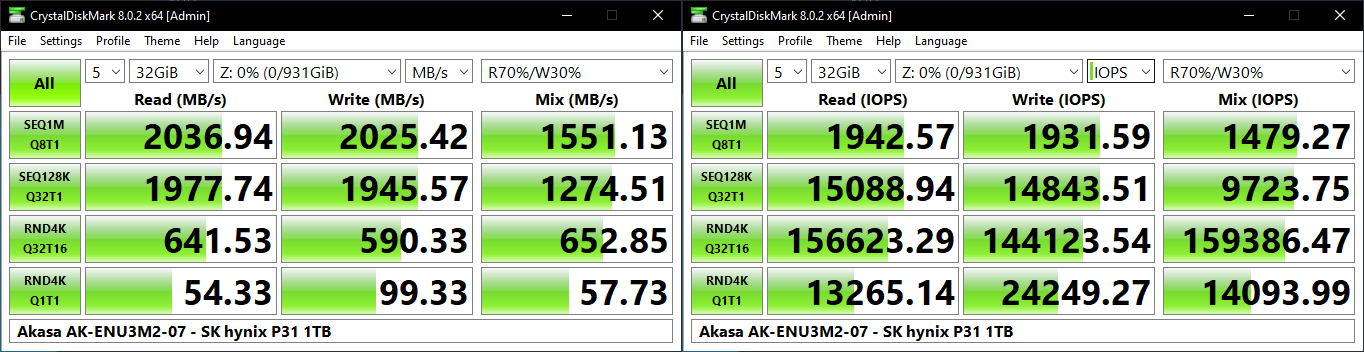
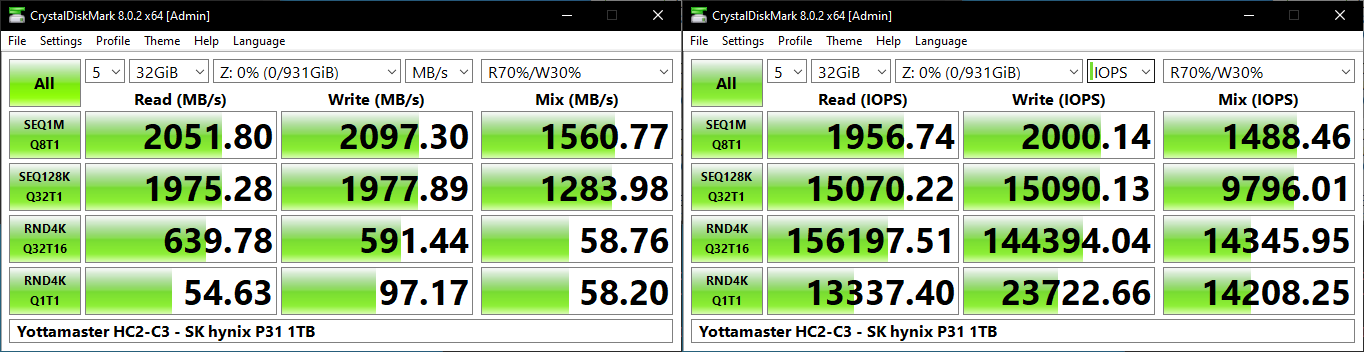
CrystalDiskMark. for example, uses four different access traces for reads and writes over a configurable region size. Two of the traces are sequential accesses, while two are 4K random accesses. Internally, CrystalDiskMark uses the Microsoft DiskSpd storage testing tool. The 'Seq128K Q32T1' sequential traces use 128K block size with a queue depth of 32 from a single thread, while the '4K Q32T16' one does random 4K accesses with the same queue configuration, but from multiple threads. The 'Seq1M' traces use a 1MiB block size. The plain 'Rnd4K' one uses only a single queue and single thread . Comparing the '4K Q32T16' and '4K Q1T1' numbers can quickly tell us whether the storage device supports NCQ (native command queuing) / UASP (USB-attached SCSI protocol). If the numbers for the two access traces are in the same ballpark, NCQ / UASP is not supported. This assumes that the host port / drivers on the PC support UASP.
| CrystalDiskMark Benchmarks | |
| TOP: | BOTTOM: |
 |
|
 |
|
Both NCQ and UASP are supported, and the benchmark numbers are approximately the same for all three ASM2364 enclosures.
AnandTech DAS Suite - Benchmarking for Performance Consistency
Our testing methodology for storage bridges / direct-attached storage units takes into consideration the usual use-case for such devices. The most common usage scenario is transfer of large amounts of photos and videos to and from the unit. Other usage scenarios include the use of the unit as a download or install location for games and importing files directly from it into a multimedia editing program such as Adobe Photoshop. Some users may even opt to boot an OS off an external storage device.
The AnandTech DAS Suite tackles the first use-case. The evaluation involves processing five different workloads:
- AV: Multimedia content with audio and video files totalling 24.03 GB over 1263 files in 109 sub-folders
- Home: Photos and document files totalling 18.86 GB over 7627 files in 382 sub-folders
- BR: Blu-ray folder structure totalling 23.09 GB over 111 files in 10 sub-folders
- ISOs: OS installation files (ISOs) totalling 28.61 GB over 4 files in one folder
- Disk-to-Disk: Addition of 223.32 GB spread over 171 files in 29 sub-folders to the above four workloads (total of 317.91 GB over 9176 files in 535 sub-folders)
Except for the 'Disk-to-Disk' workload, each data set is first placed in a 29GB RAM drive, and a robocopy command is issue to transfer it to the external storage unit (formatted in exFAT for flash-based units, and NTFS for HDD-based units).
robocopy /NP /MIR /NFL /J /NDL /MT:32 $SRC_PATH $DEST_PATH
Upon completion of the transfer (write test), the contents from the unit are read back into the RAM drive (read test) after a 10 second idling interval. This process is repeated three times for each workload. Read and write speeds, as well as the time taken to complete each pass are recorded. Whenever possible, the temperature of the external storage device is recorded during the idling intervals. Bandwidth for each data set is computed as the average of all three passes.
The 'Disk-to-Disk' workload involves a similar process, but with one iteration only. The data is copied to the external unit from the CPU-attached NVMe drive, and then copied back to the internal drive. It does include more amount of continuous data transfer in a single direction, as data that doesn't fit in the RAM drive is also part of the workload set.
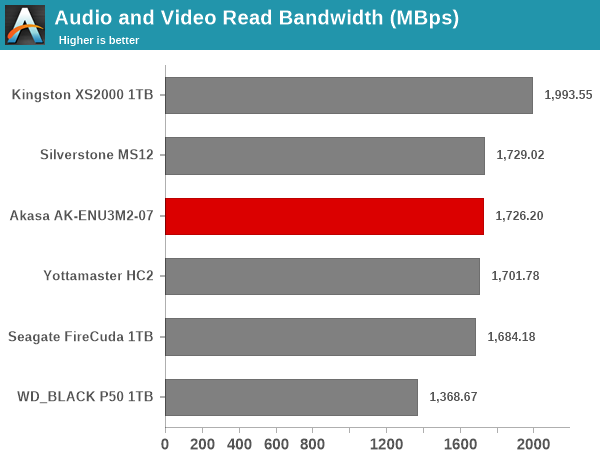
It can be seen that there is no significant gulf in the numbers between the different ASM2364 enclosures. For all practical purposes, the casual user will notice no difference between them in the course of normal usage. For certain workloads, the native UFD controller solution in the Kingston XS2000 works better. The internal SSD characteristics may also help in certain traces, as shown in the performance of the Seagate FireCuda USB 3.2 Gen 2x2 solution in some of the workloads. Beyond this, power users may want to dig deeper to understand the limits of each device. To address this concern, we also instrumented our evaluation scheme for determining performance consistency.
Performance Consistency
Aspects influencing the performance consistency include SLC caching and thermal throttling / firmware caps on access rates to avoid overheating. This is important for power users, as the last thing that they want to see when copying over 100s of GB of data is the transfer rate going down to USB 2.0 speeds.
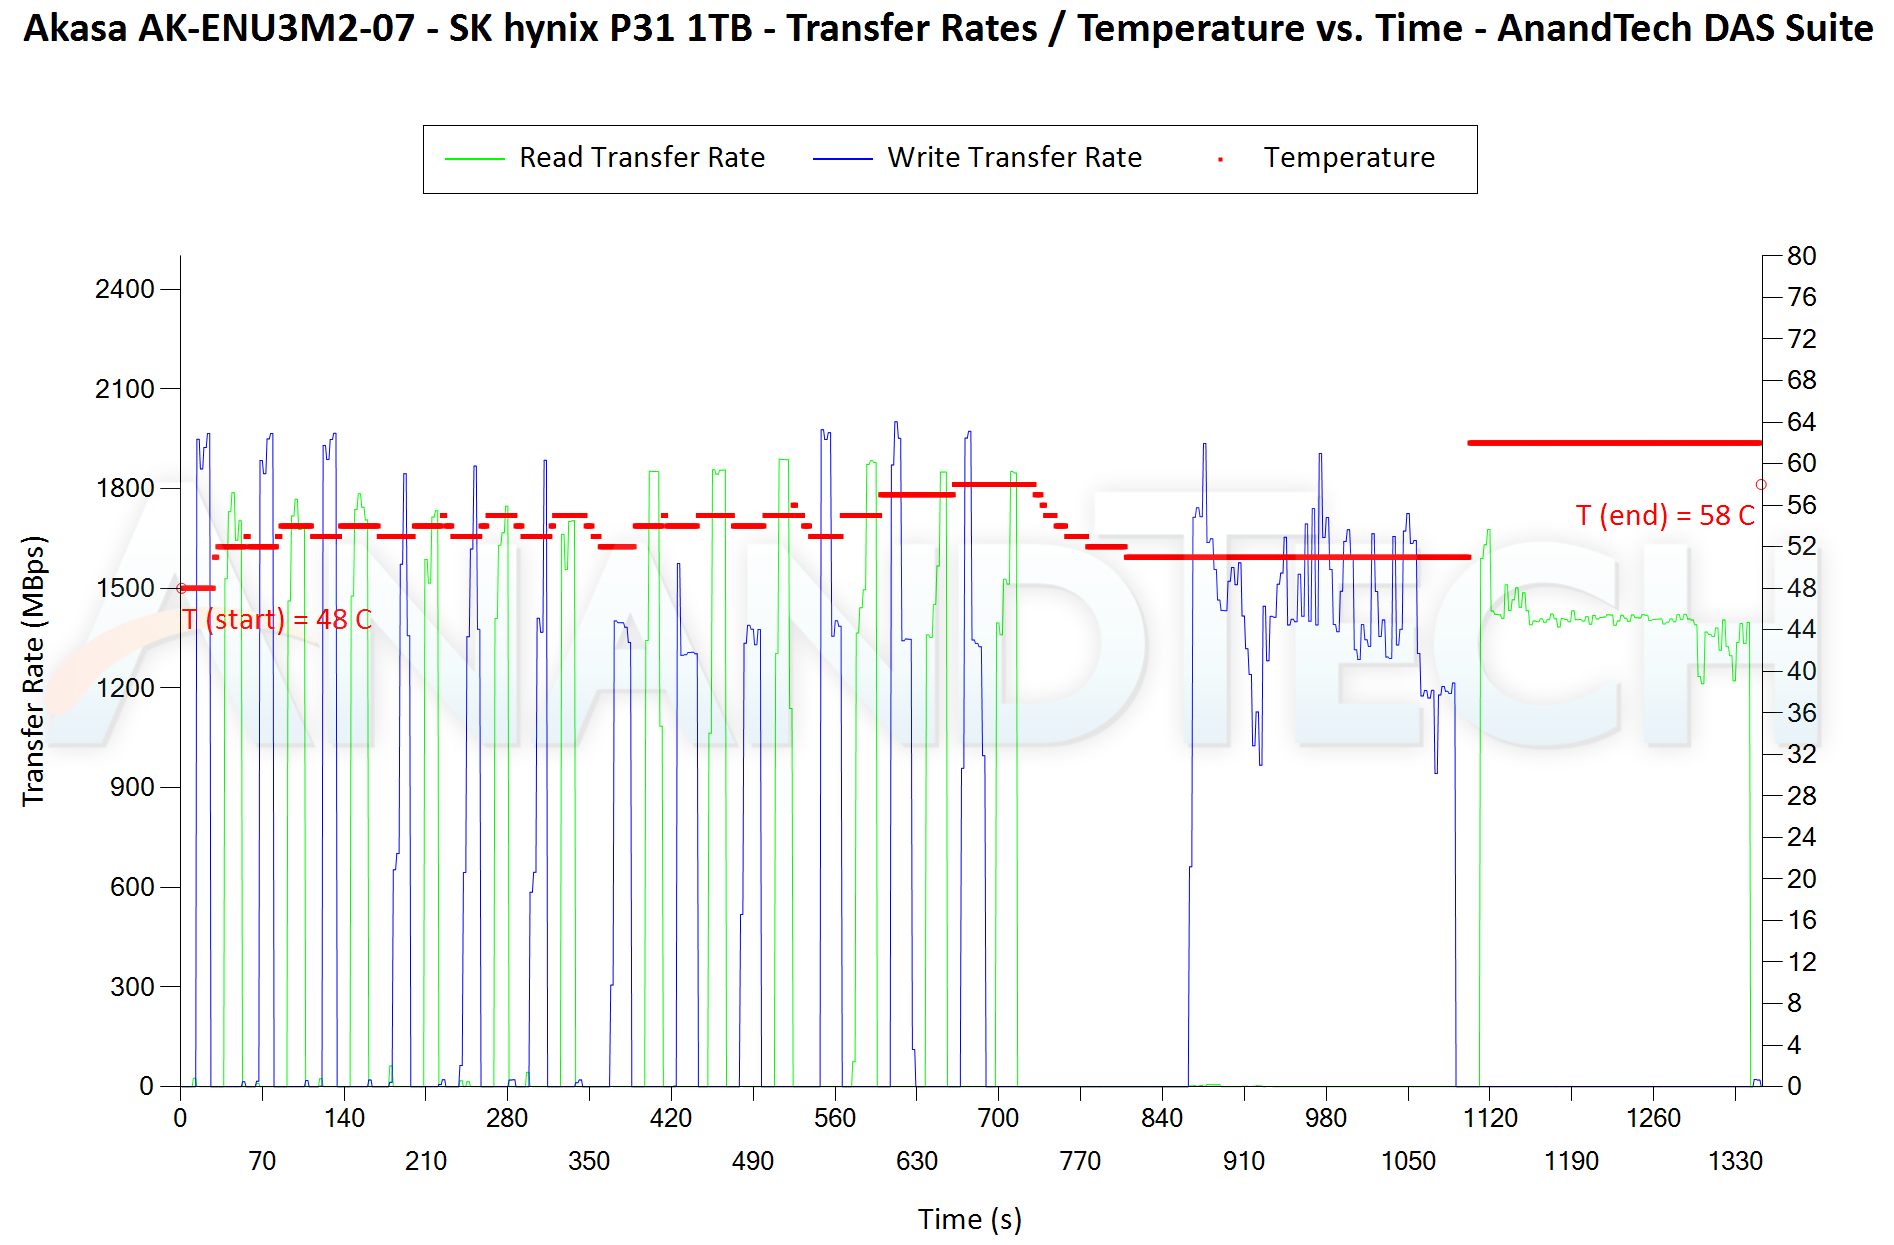
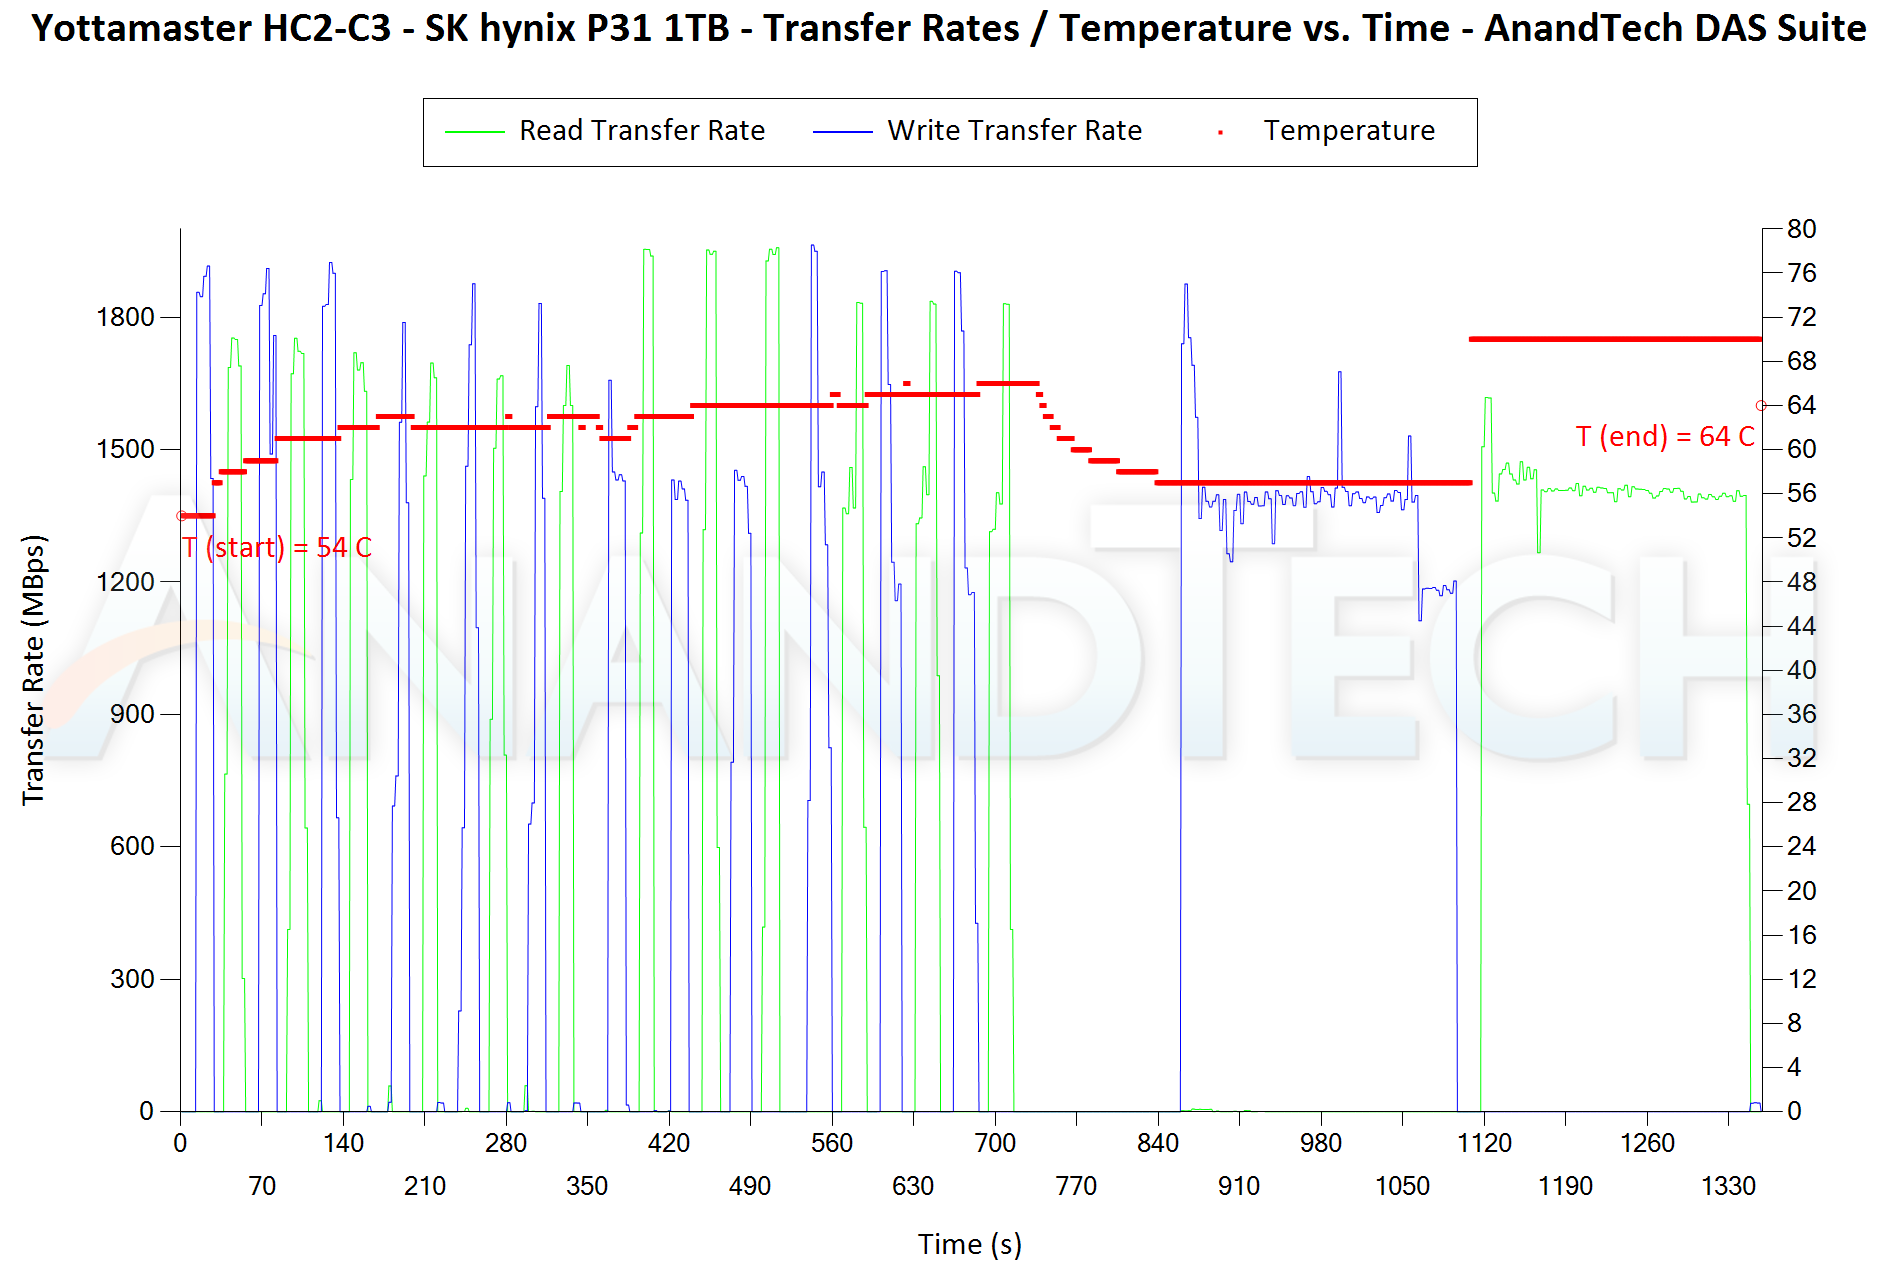
In addition to tracking the instantaneous read and write speeds of the DAS when processing the AnandTech DAS Suite, the temperature of the drive was also recorded. In earlier reviews, we used to track the temperature all through. However, we have observed that SMART read-outs for the temperature in NVMe SSDs using USB 3.2 Gen 2 bridge chips end up negatively affecting the actual transfer rates. To avoid this problem, we have restricted ourselves to recording the temperature only during the idling intervals. The graphs below present the recorded data.
| AnandTech DAS Suite - Performance Consistency | |
| TOP: | BOTTOM: |
 |
|
 |
|
The first three sets of writes and reads correspond to the AV suite. A small gap (for the transfer of the video suite from the internal SSD to the RAM drive) is followed by three sets for the Home suite. Another small RAM-drive transfer gap is followed by three sets for the Blu-ray folder. This is followed up with the large-sized ISO files set. Finally, we have the single disk-to-disk transfer set. First off, we see no signs of thermal throttling, with all three enclosures taking similar amounts of time to complete the test. The interesting aspect here is temperature - the AK-ENU3M2-07 has the least delta between starting and ending temperatures out of the three ASM2364 enclosures.
PCMark 10 Storage Bench - Real-World Access Traces
There are a number of storage benchmarks that can subject a device to artificial access traces by varying the mix of reads and writes, the access block sizes, and the queue depth / number of outstanding data requests. We saw results from two popular ones - ATTO, and CrystalDiskMark - in a previous section. More serious benchmarks, however, actually replicate access traces from real-world workloads to determine the suitability of a particular device for a particular workload. Real-world access traces may be used for simulating the behavior of computing activities that are limited by storage performance. Examples include booting an operating system or loading a particular game from the disk.
PCMark 10's storage bench (introduced in v2.1.2153) includes four storage benchmarks that use relevant real-world traces from popular applications and common tasks to fully test the performance of the latest modern drives:
- The Full System Drive Benchmark uses a wide-ranging set of real-world traces from popular applications and common tasks to fully test the performance of the fastest modern drives. It involves a total of 204 GB of write traffic.
- The Quick System Drive Benchmark is a shorter test with a smaller set of less demanding real-world traces. It subjects the device to 23 GB of writes.
- The Data Drive Benchmark is designed to test drives that are used for storing files rather than applications. These typically include NAS drives, USB sticks, memory cards, and other external storage devices. The device is subjected to 15 GB of writes.
- The Drive Performance Consistency Test is a long-running and extremely demanding test with a heavy, continuous load for expert users. In-depth reporting shows how the performance of the drive varies under different conditions. This writes more than 23 TB of data to the drive.
Despite the data drive benchmark appearing most suitable for testing direct-attached storage, we opt to run the full system drive benchmark as part of our evaluation flow. Many of us use portable flash drives as boot drives and storage for Steam games. These types of use-cases are addressed only in the full system drive benchmark.
The Full System Drive Benchmark comprises of 23 different traces. For the purpose of presenting results, we classify them under five different categories:
- Boot: Replay of storage access trace recorded while booting Windows 10
- Creative: Replay of storage access traces recorded during the start up and usage of Adobe applications such as Acrobat, After Effects, Illustrator, Premiere Pro, Lightroom, and Photoshop.
- Office: Replay of storage access traces recorded during the usage of Microsoft Office applications such as Excel and Powerpoint.
- Gaming: Replay of storage access traces recorded during the start up of games such as Battlefield V, Call of Duty Black Ops 4, and Overwatch.
- File Transfers: Replay of storage access traces (Write-Only, Read-Write, and Read-Only) recorded during the transfer of data such as ISOs and photographs.
PCMark 10 also generates an overall score, bandwidth, and average latency number for quick comparison of different drives. The sub-sections in the rest of the page reference the access traces specified in the PCMark 10 Technical Guide.
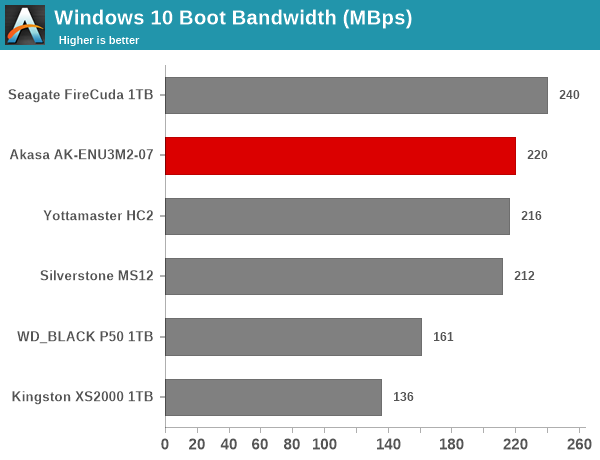
Booting Windows 10
The read-write bandwidth recorded for each drive in the boo access trace is presented below.
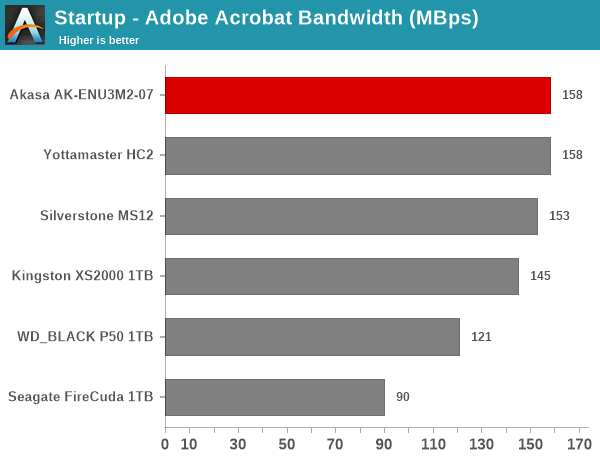
Creative Workloads
The read-write bandwidth recorded for each drive in the sacr, saft, sill, spre, slig, sps, aft, exc, ill, ind, psh, and psl access traces are presented below.
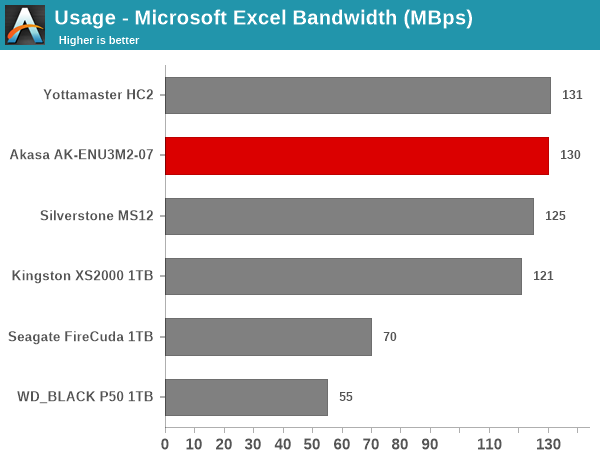
Office Workloads
The read-write bandwidth recorded for each drive in the exc and pow access traces are presented below.
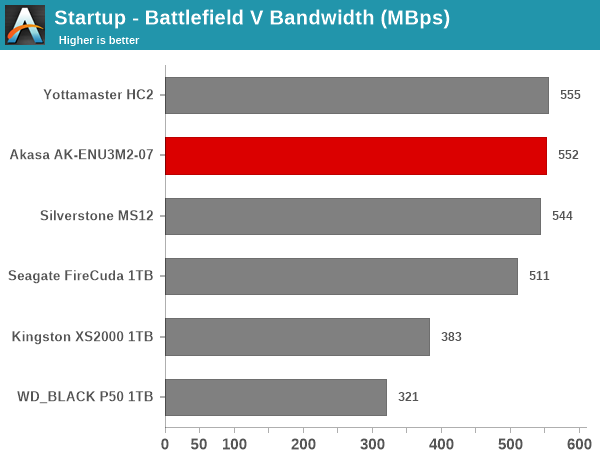
Gaming Workloads
The read-write bandwidth recorded for each drive in the bf, cod, and ow access traces are presented below.
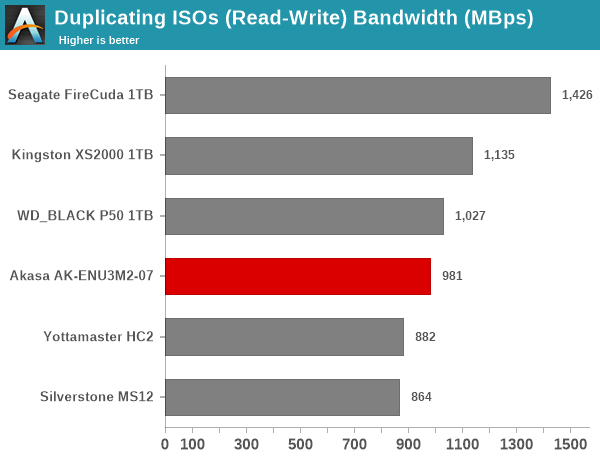
Files Transfer Workloads
The read-write bandwidth recorded for each drive in the cp1, cp2, cp3, cps1, cps2, and cps3 access traces are presented below.
Overall Scores
PCMark 10 reports an overall score based on the observed bandwidth and access times for the full workload set. The score, bandwidth, and average access latency for each of the drives are presented below.
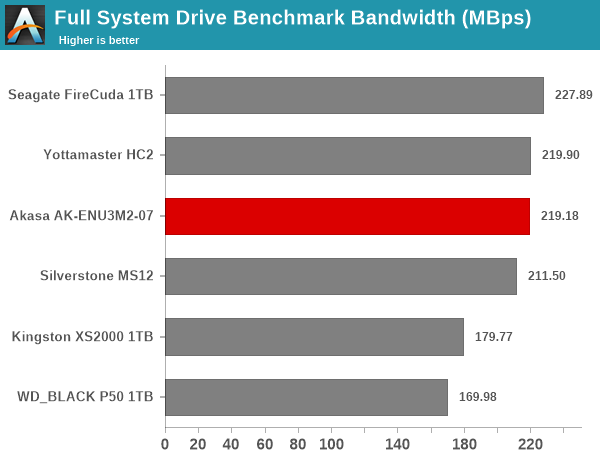
There is not much to choose betewen the three ASM2364 solutions in the PCMark 10 traces, as expected. From a performance viewpoint, the internal SSD matters more, as we see differences in performance between the WD_BLACK P50 and the Seagate FireCuda. Thre three enclosures come in the middle of the pack with similar scores due to the same SSD being used in them. The bridge firmware differences do not result in any major performance deviations.


15 Comments
View All Comments
back2future - Tuesday, August 2, 2022 - link
Even Thunderbolt 3 enclosures are on a >~$75, ASM4242 (<=64Gb/s) and JHL8440/JHL8540 for TB4 seems being discussed (, with even TB5 data (80Gb/s) given to public 2021, ~one year ago).Are there (external consumer) Usb 3.2 hubs available?
abufrejoval - Monday, August 8, 2022 - link
My feeling is that in terms of ease of handling NVMe has just been an enormous stepback vs. SATA SSDs.I love how I could just play around with them like in the good old floppy days, put them here, put them there, move them from system to system, have them be a boot drive here, back them up via another one there, join them into a JBOD/RAID0 a little later in life etc. I've always hated storage being tied to a system, something rather unnatural in early computers and something that IMHO Microsoft mostly pushed to fight pirating in pre-permanently-online times.
Tray-less hot-swap drive bay caddies for where the CD/DVD drives used to go in notebooks extended that enormous flexibility there, too. Sometimes I'd even move a complex long-running application setup (e.g. Ansible) to a different system for speed and then pop it back into the low-noise one where it was supposed to run after being all ready.
Far too often the ability to pop out every other drive when installing a newish OS was the only way to preserve a production environment from the newcomer thrashing man-years to bits.
U.2 caddies for M.2 almost deliver similar flexibility again, but come at quite a bit of a premium. But that would only really pay off, if Thunderbolt was universally available on notebooks and NUCs for external attachment.
Because it's not just speed that suffers from USB vs. PCIe, but also compatibility in the form of device naming.
If you move M.2 NVMe drives from an on-board slot or TB to something USB or vice versa, there is a good chance you'll loose the ability to boot the system.
And then there is all sorts of renumbering of partitions, automatic UEFI reconfiguration when disks are inserted temporarily, which have nothing to do with USB vs. NVMe but how ancient DOS (disk operating systems) have a hard time dealing with the dynamics enabled by hardware today.
The Silicon Motion SM2320 in the Data Traveler proves rather well, that near NVMe performance can be put into a size and power envelope that is no longer a compromise between size and performance: it's not quite µ-SDcard in terms of size, but it's a far step from the clunky 1st gen external TB drive enclosures while performance is getting nicely close to native NVMe.
What we lack is a physical form factor to go along with it. Yes, external fully plugable is nice. Until you boot or depend on it and move the hosting notebook around. Then you'd rather not have it sticking out, yet removable.
I never considered PCMCIA as being all too big, but these days SO-DIMM slots are getting killed on Ultrabooks for using much less space. Pretty sure you could fit 8TB of storage and 3 Watts of heat dissipation into that form factor today...
I'm also pretty sure something like the Data Traveller (0.25-1/2TB) could be fit into an Ultrabook compatbile Compact Flash form factor, which Apple would oppose for the obvious reason that their business model highly depends on extorting for non-expandability.
If NVMe performance and multiple terabytes could be fit into a µ-SDcard form factor already, none of the above would have been written. I'm not convinced that combination can be achieved very soon.
So as a consumer, I'd have a simple message to the vendors: please get your act together and offer us the highest level of performance and flexibility at the most reasonable price in a form factor that works across the majority of all personal computing devices!
But those guys just want to make money; more money by eliminating competition and customer choice.
lmcd - Thursday, August 18, 2022 - link
Honestly what are you even talking about? I pull NVMe drives from machines and boot them from USB enclosures with absolutely no issues and vice versa up to a dozen times a day.Your SODIMM comments are completely off base. LPDDR5 notebooks are competing in bandwidth with HEDT 4-channel systems from the simple fact that DIMM pins take space. Laptops with SODIMMs give up a lot for SODIMMs, not just space on the board. A laptop with a high-end LPDDR5 configuration can outcompete most consumer desktops in bandwidth.
I think your form factor comments demo that you're just spitballing. On the one hand, we've only recently got native USB SSD controllers. Those will enable other form factors. The space will ramp up soon enough and in small enough form to fit happily in a USB-C flash drive form factor. For insertion, CF has a PCIe-based version. You could've, you know, looked at the wikipedia page for CF before posting?
FGeorge - Tuesday, November 15, 2022 - link
I have 3 nvme SSDs which I constantly swap in and out of this enclosure, one has Windows 11 to go, the other one has Linux mint, and the third one I have it with Windows 7, for when I feel nostalgic. I boot from all three of them with the same speed as I get from my internal gen 4 4x4 Samsung 980pro. The only difference is when I run CrystalDiskmark, and the transfer speeds show to be slower with the external SSDs, But that doesn't affect my usage, and it really doesn't get much easier than swapping these drives in and out. With a SATA 3 SSD, I had to connect the data, plus the power cable, my computer today doesn't even have a SATA power cable connected from the PSU. So, this comment of yours bashing NVME SSDs over SATA SSDs doesn't make much sense.CalliopeAdrianna - Sunday, August 21, 2022 - link
hallo