The Intel Core Ultra 7 155H Review: Meteor Lake Marks A Fresh Start To Mobile CPUs
by Gavin Bonshor on April 11, 2024 8:30 AM ESTASUS Zenbook 14 OLED UX3405MA: Rendering & Simulation Performance
Rendering tests are often a little more simple to digest and automate than others. All the tests give out some sort of score or time, usually in an obtainable way that makes it fairly easy to extract. These tests are some of the most strenuous in our list due to the highly threaded nature of rendering and ray-tracing, and they can draw a lot of power. Power isn't so much a problem on mobile platforms, but rendering performance and how it relates to varied workloads such as video editing, is still a vital part of overall performance.
Different from rendering, in our Simulation section, these tests act more like synthetic benchmarks but, at some level, are still trying to simulate a given environment.
For this review, we have included the AMD Ryzen 9 7940HS, which includes the same Radeon 780M integrated graphics, along with the Ryzen 5 8600G, which uses the AMD Phoenix mobile architecture but is adopted for desktops. This allows us to show more data points for our review of Intel's Meteor Lake-based Core Ultra 7 155H to see where performance lies.
Despite including AMD's Phoenix-based Ryzen 8000G APUs in our results, as we expand our list of notebooks tested, we'll have more effective and comparable data points in the future. To add more reference, all of the chips have been tested with Windows 11 22H2.
Rendering
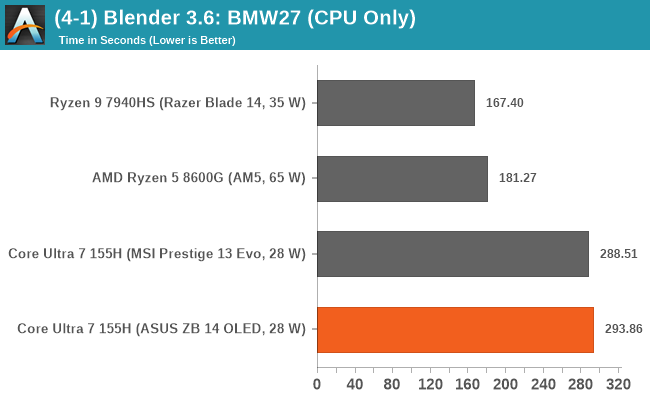
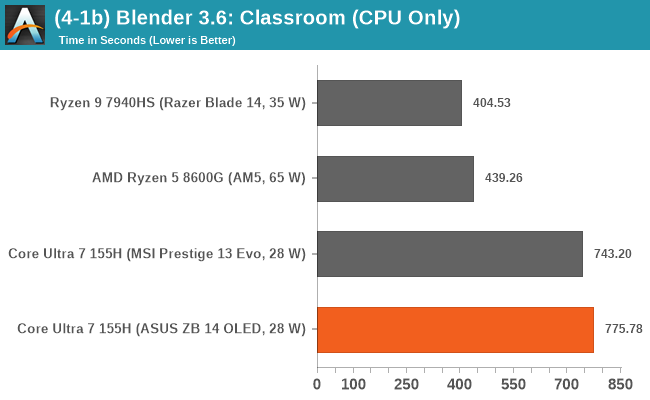
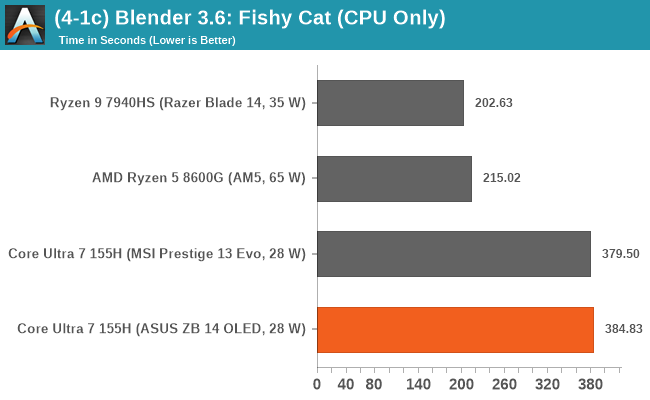
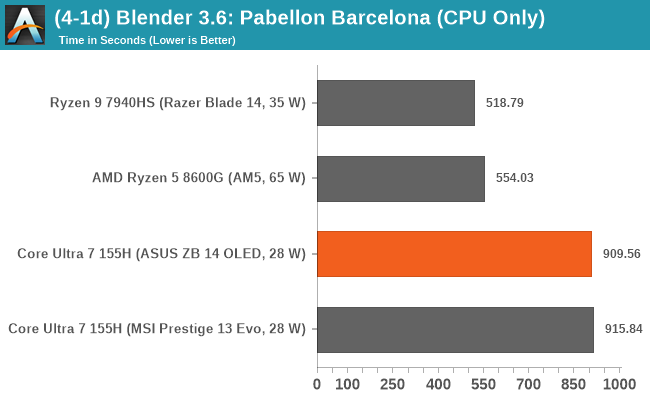
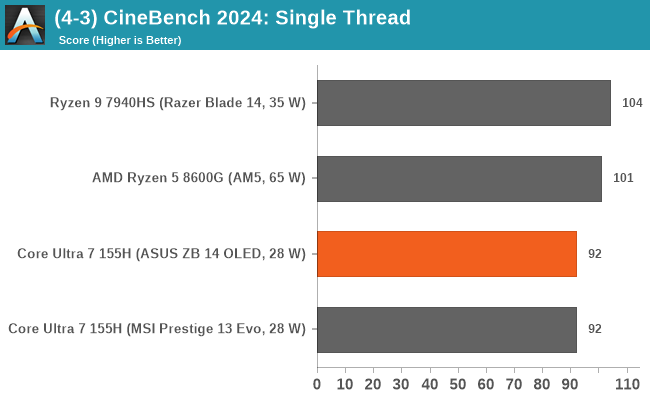
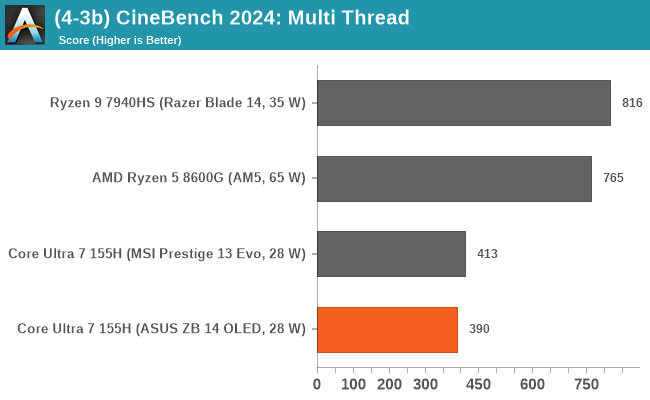
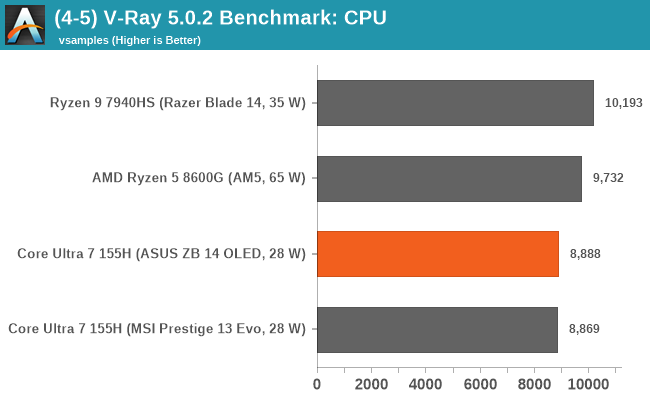
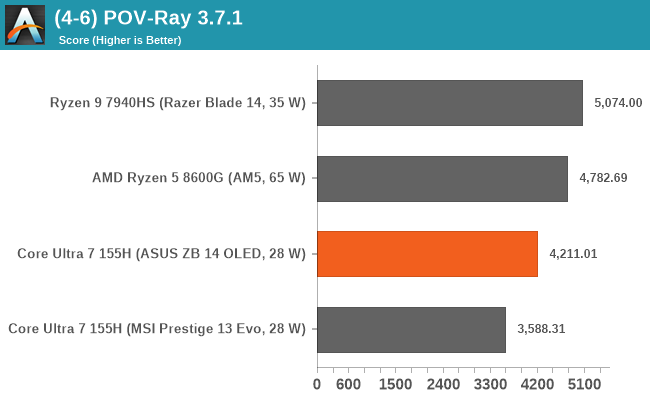
As we can see from our rendering results, the Intel Core Ultra 7 155H is quite competitive in single-threaded performance and is a little behind AMD's Zen 4 mobile Phoenix-based Ryzen 9 7940HS. The situation changes somewhat when we move to multi-threaded performance, with the Meteor Lake notebooks lagging behind in all Blender 3.6 tests. Things look better in our POV-Ray test, with a competitive showing, and there is a similar situation in the V-Ray benchmark.
Simulation
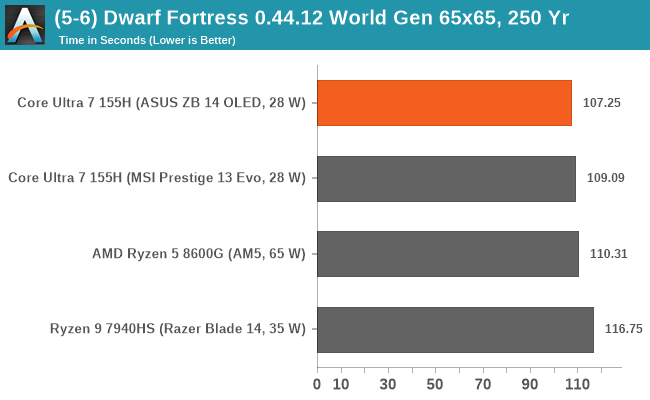
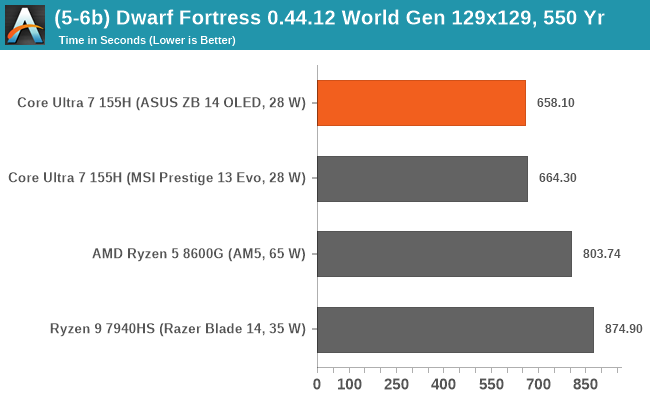
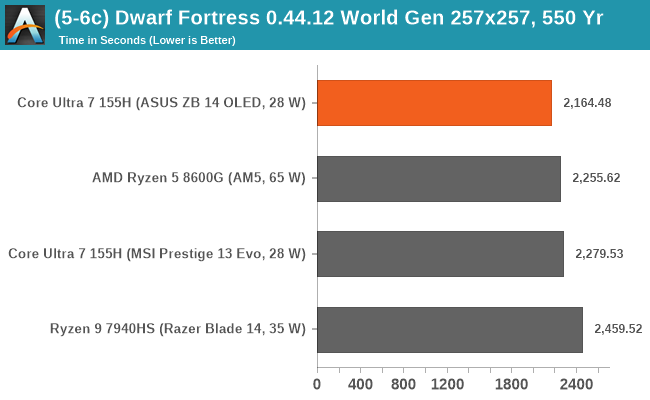
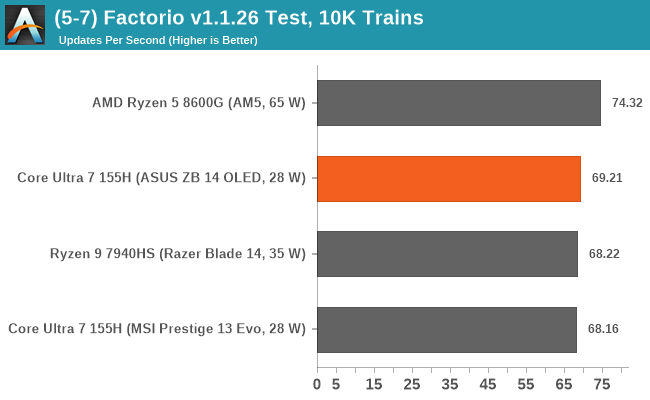
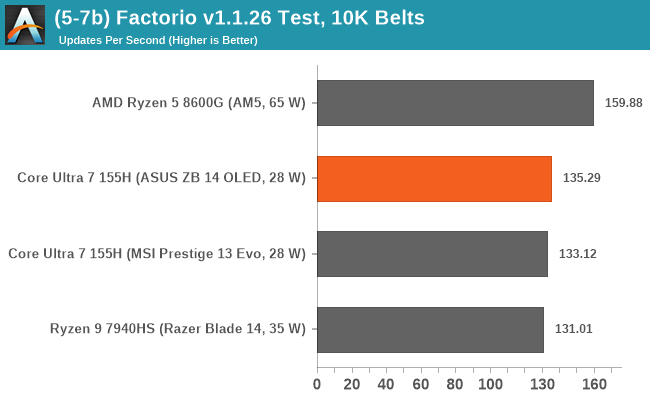
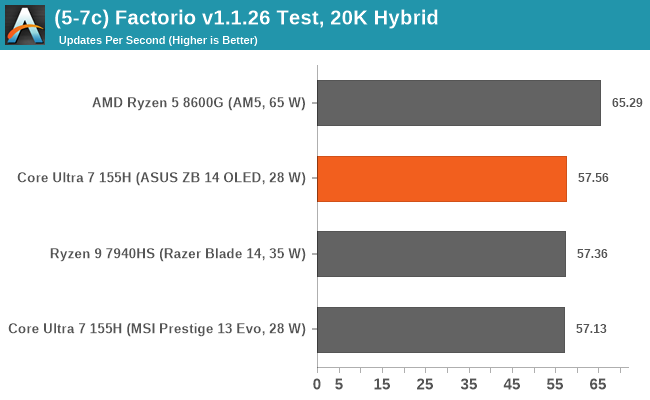
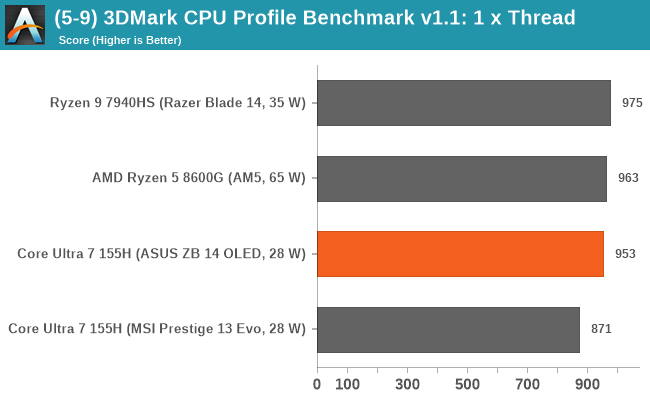
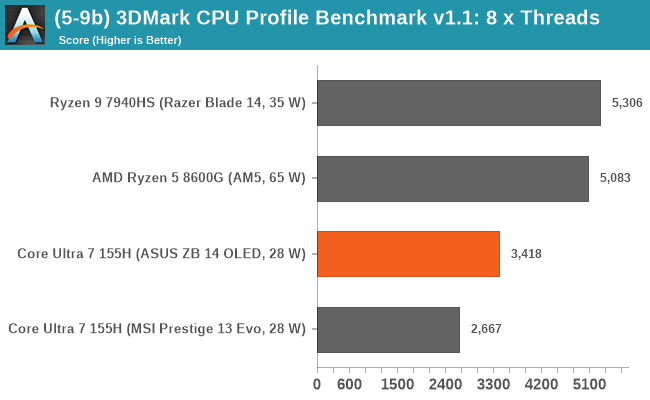
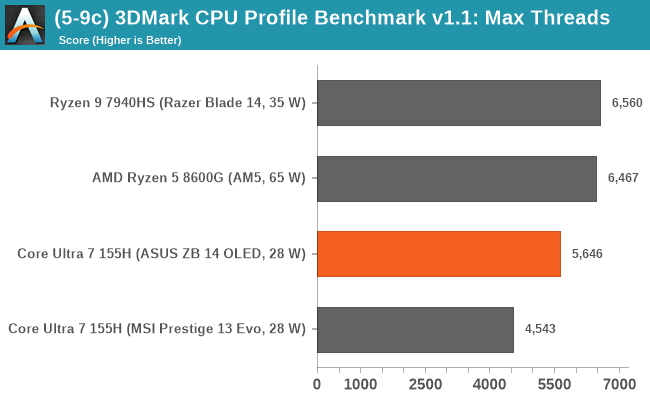
Our simulation benchmarks show that the Intel Core Ultra 7 155H outperforms the Ryzen 9 7940HS and even the desktop Ryzen 8000G series processors in Dwarf Fortress. In our Factorio tests, Meteor Lake is also very competitive with the AMD Phoenix-based chips, although the AMD chips perform better in the 3D Mark CPU profile with maximum threads.


69 Comments
View All Comments
Gavin Bonshor - Friday, April 12, 2024 - link
I refer to it as a major gain; the other victories weren't huge. That was my point Replysjkpublic@gmail.com - Thursday, April 11, 2024 - link
Comparing the 155H to the 7940HS is apples to oranges. A better comparison would be the 185H. ReplyBigos - Thursday, April 11, 2024 - link
What happened to SPECint rate-N 502.gcc_r results? I do not believe desktop Raptor Lake is 16-40x faster than the mobile CPUs... ReplySarahKerrigan - Thursday, April 11, 2024 - link
No, something is clearly wrong there. I deal with SPEC a lot for work and that's an abnormally low result unless it was actually being run in rate-1 mode (ie, someone forgot to properly set the number of copies.) ReplyGavin Bonshor - Friday, April 12, 2024 - link
I am currently investigating this. Thank you for highlighting it. I have no idea how I missed this. I can only apologize Replymode_13h - Monday, April 15, 2024 - link
While we're talking about SPEC2017 scores, I'd like to add that I really miss the way your reviews used to feature the overall cumulative SPECfp and SPECint scores. It was useful in comparing overall performance, both of the systems included in your review and those from other reviews.To see what I mean, check out the bottom of this page: https://www.anandtech.com/show/17047/the-intel-12t... Reply
Ryan Smith - Monday, April 15, 2024 - link
That's helpful feedback. It's a bit late to add it to this article, but that's definitely something I'll keep in mind for the next one. Thanks! Replymode_13h - Wednesday, April 17, 2024 - link
You're quite welcome!BTW, I assume there's a "standard" way that SPEC computes those cumulative scores. Might want to look up how they do it, if the benchmark doesn't just compute them for you. If you come up with your own way of combining them, your cumulative scores probably won't be comparable to anyone else's. Reply
Ryan Smith - Wednesday, April 17, 2024 - link
"BTW, I assume there's a "standard" way that SPEC computes those cumulative scores."Yes, there is. We don't run all of the SPEC member tests for technical reasons, so there is some added complexity there. Reply
mczak - Thursday, April 11, 2024 - link
Obviously, the cluster topology description is wrong in the core to core latency measturements section, along with the hilarious conclusion the first two E-cores having only 5 ns latency to each other. (First two threads of course belong to a P-core, albeit I have no idea why the core enumeration is apparently 1P-8E-5P-2LPE.) Reply