Intel Haswell-EP Xeon 14 Core Review: E5-2695 V3 and E5-2697 V3
by Ian Cutress on November 20, 2014 10:00 AM ESTProfessional Performance: Windows
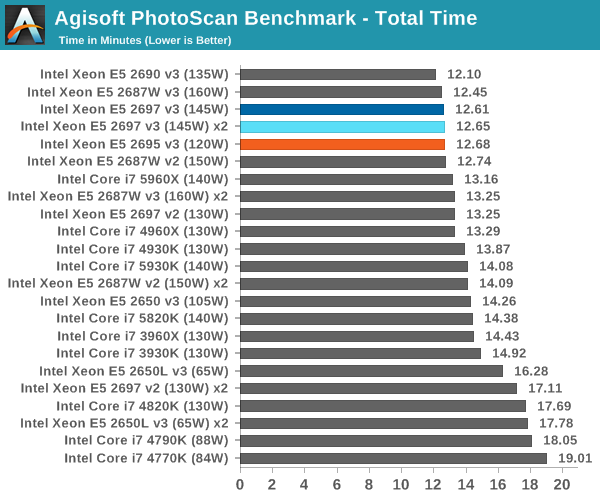
Agisoft Photoscan – 2D to 3D Image Manipulation: link
Agisoft Photoscan creates 3D models from 2D images, a process which is very computationally expensive. The algorithm is split into four distinct phases, and different phases of the model reconstruction require either fast memory, fast IPC, more cores, or even OpenCL compute devices to hand. Agisoft supplied us with a special version of the software to script the process, where we take 50 images of a stately home and convert it into a medium quality model. This benchmark typically takes around 15-20 minutes on a high end PC on the CPU alone, with GPUs reducing the time.
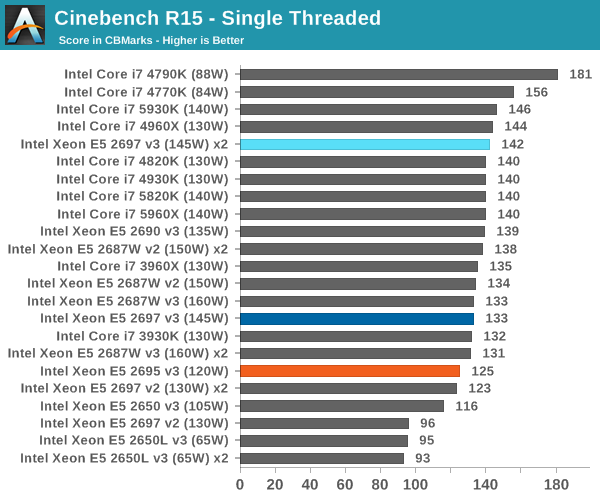
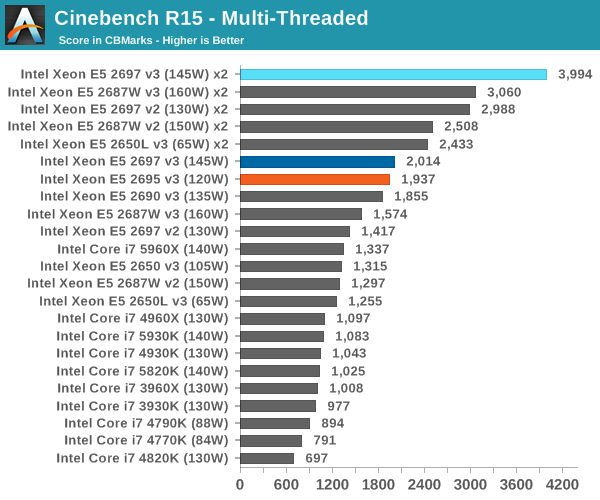
Cinebench R15
Professional Performance: Linux
Built around several freely available benchmarks for Linux, Linux-Bench is a project spearheaded by Patrick at ServeTheHome to streamline about a dozen of these tests in a single neat package run via a set of three commands using an Ubuntu 14.04 LiveCD. These tests include fluid dynamics used by NASA, ray-tracing, molecular modeling, and a scalable data structure server for web deployments. We run Linux-Bench and have chosen to report a select few of the tests that rely on CPU and DRAM speed.
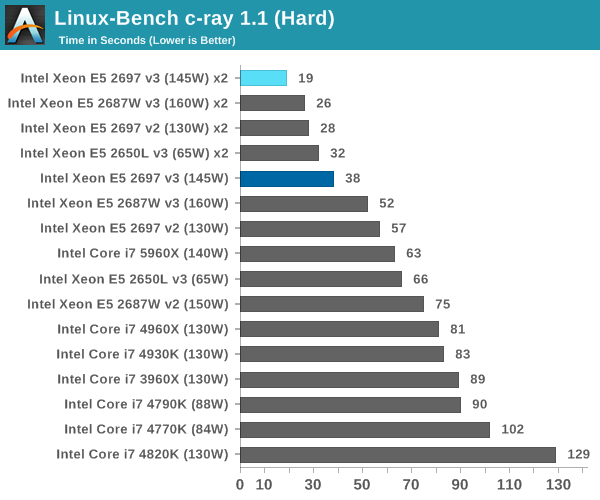
C-Ray: link
C-Ray is a simple ray-tracing program that focuses almost exclusively on processor performance rather than DRAM access. The test in Linux-Bench renders a heavy complex scene offering a large scalable scenario.
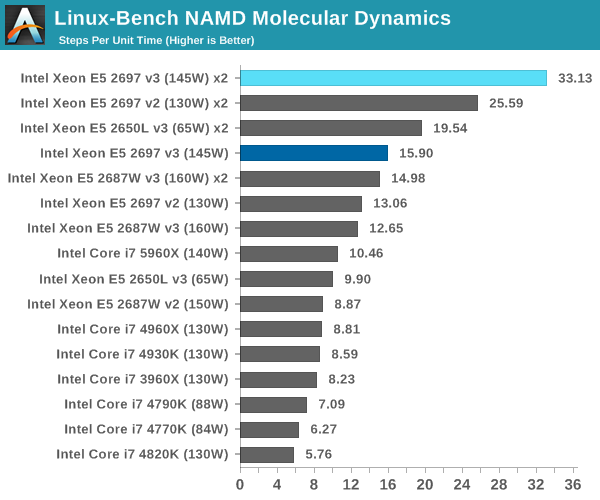
NAMD, Scalable Molecular Dynamics: link
Developed by the Theoretical and Computational Biophysics Group at the University of Illinois at Urbana-Champaign, NAMD is a set of parallel molecular dynamics codes for extreme parallelization up to and beyond 200,000 cores. The reference paper detailing NAMD has over 4000 citations, and our testing runs a small simulation where the calculation steps per unit time is the output vector.
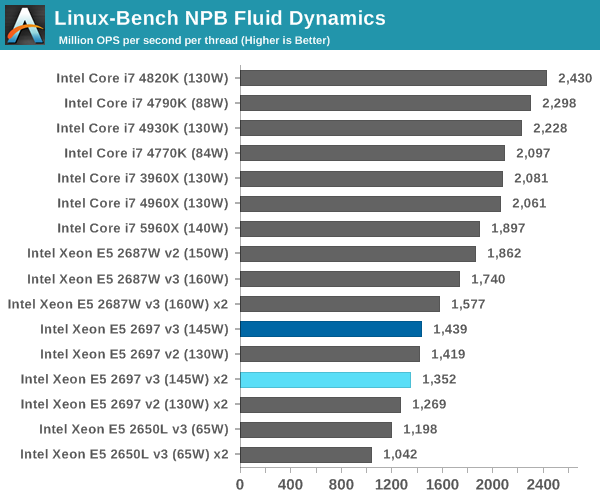
NPB, Fluid Dynamics: link
Aside from LINPACK, there are many other ways to benchmark supercomputers in terms of how effective they are for various types of mathematical processes. The NAS Parallel Benchmarks (NPB) are a set of small programs originally designed for NASA to test their supercomputers in terms of fluid dynamics simulations, useful for airflow reactions and design.
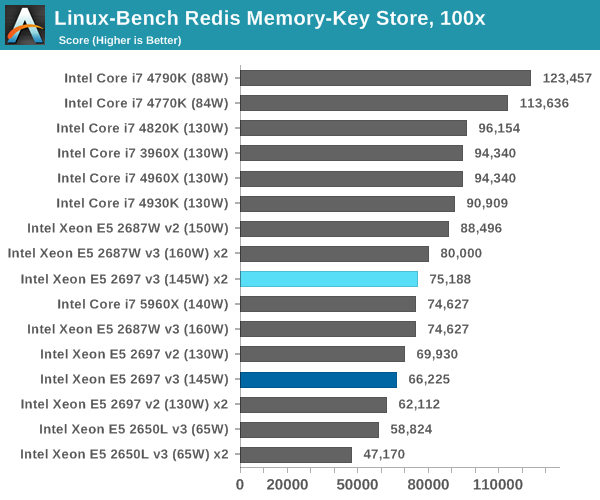
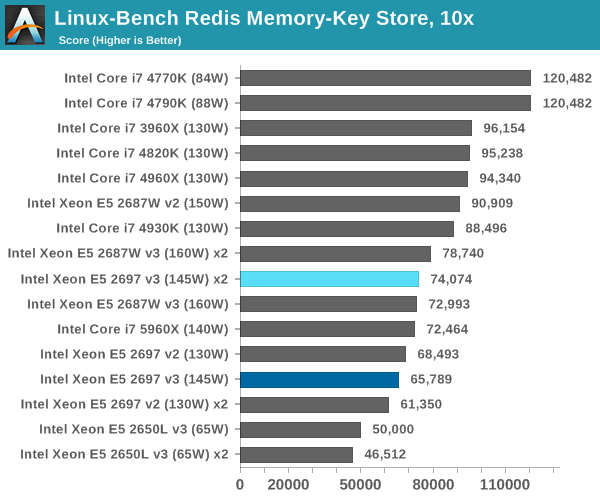
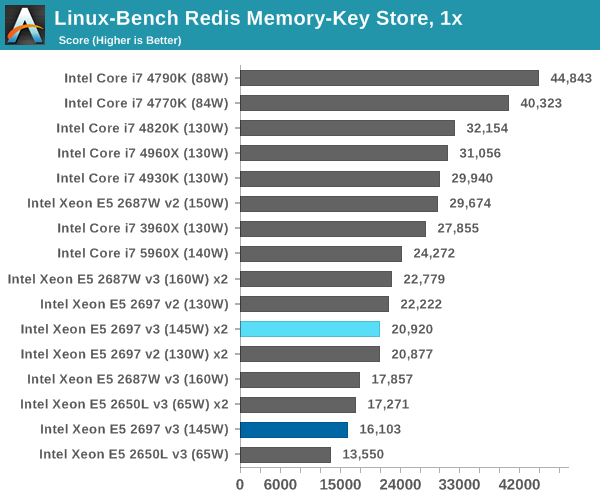
Redis: link
Many of the online applications rely on key-value caches and data structure servers to operate. Redis is an open-source, scalable web technology with a strong developer base, but also relies heavily on memory bandwidth.


44 Comments
View All Comments
Wolfpup - Tuesday, November 25, 2014 - link
This is awesome :-D I'll never get to touch one of these, even at work, but it's still ridiculous fun to read about them, much less see game benchmarks on them.(Imagine a game actually designed for 18 Haswell cores LOL)
I'd loooove to run Folding @ Home across that many cores!
daresystem - Monday, December 15, 2014 - link
It's interesting, I am actually system builder, so this information is very useful for me. Why you didn't benchmark it with VMWare? I've been using S2600CP for entire my client for year, and I just curious with the performance this processor in real Server usage.Thank you.
jackdgalloway - Friday, June 12, 2015 - link
Regarding the "snoop mode". I got two dual socket, Intel(R) Xeon(R) CPU E5-2697 v3 boxes and found them performing 15% slower on a finite element code than the previous generation dual socket Intel(R) Xeon(R) CPU E5-2697 v2 boxes we had. After much investigation I found the snoop mode was set to early snoop, changing to "cluster on die" sped up the FEA simulation immensely, with that one change the box then outperforming the V2 counterpart by 25%. This was great, however I'm still encountering one problem. I have a monte carlo particle transport code (not a matrix dominant code) whose performance was unaffected by this change, and is still 50% slower than the v2 counterpart. All that said, any intuition on why might be and either troubleshooting thoughts, architecture differences that could cause this, or any other BIOS settings to try?lucien_br - Sunday, March 5, 2017 - link
Xeon V3 with actual game BF1:https://www.youtube.com/watch?v=Faae3_Tdtfw