G.Skill Phoenix Blade (480GB) PCIe SSD Review
by Kristian Vättö on December 12, 2014 9:02 AM ESTAnandTech Storage Bench 2013
Our Storage Bench 2013 focuses on worst-case multitasking and IO consistency. Similar to our earlier Storage Benches, the test is still application trace based – we record all IO requests made to a test system and play them back on the drive we are testing and run statistical analysis on the drive's responses. There are 49.8 million IO operations in total with 1583.0GB of reads and 875.6GB of writes. I'm not including the full description of the test for better readability, so make sure to read our Storage Bench 2013 introduction for the full details.
| AnandTech Storage Bench 2013 - The Destroyer | ||
| Workload | Description | Applications Used |
| Photo Sync/Editing | Import images, edit, export | Adobe Photoshop CS6, Adobe Lightroom 4, Dropbox |
| Gaming | Download/install games, play games | Steam, Deus Ex, Skyrim, Starcraft 2, BioShock Infinite |
| Virtualization | Run/manage VM, use general apps inside VM | VirtualBox |
| General Productivity | Browse the web, manage local email, copy files, encrypt/decrypt files, backup system, download content, virus/malware scan | Chrome, IE10, Outlook, Windows 8, AxCrypt, uTorrent, AdAware |
| Video Playback | Copy and watch movies | Windows 8 |
| Application Development | Compile projects, check out code, download code samples | Visual Studio 2012 |
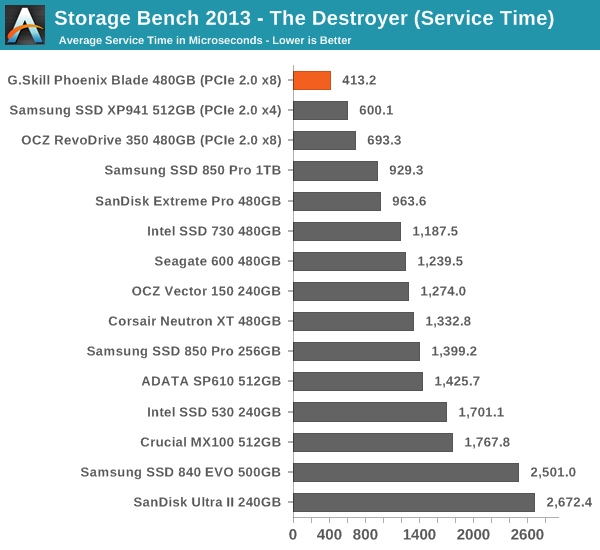
We are reporting two primary metrics with the Destroyer: average data rate in MB/s and average service time in microseconds. The former gives you an idea of the throughput of the drive during the time that it was running the test workload. This can be a very good indication of overall performance. What average data rate doesn't do a good job of is taking into account response time of very bursty (read: high queue depth) IO. By reporting average service time we heavily weigh latency for queued IOs. You'll note that this is a metric we have been reporting in our enterprise benchmarks for a while now. With the client tests maturing, the time was right for a little convergence.
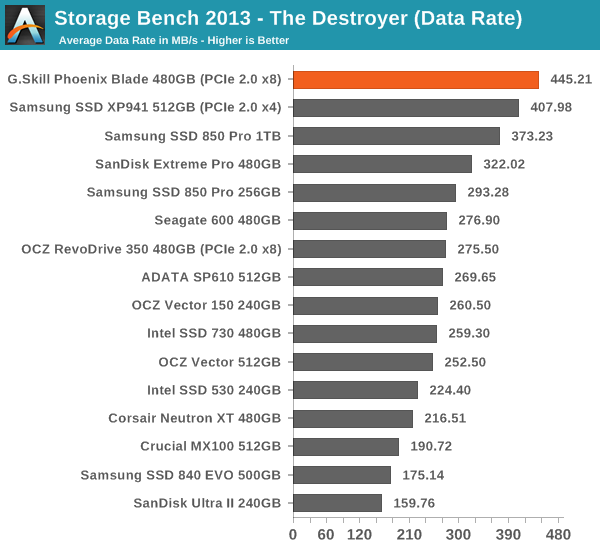
Quite surprisingly, the Phoenix Blade takes the lead in our 2013 Storage Bench and even beats the XP941. After reviewing the RevoDrive 350, I didn't get my hopes up for the Phoenix Blade, but it looks like G.Skill has done a much better job at optimizing the drive for performance.


62 Comments
View All Comments
Supercell99 - Friday, December 12, 2014 - link
Did we ever found out about the endurance of the XP941? Is it artificially limited? The endurance of the GSKILL blade may actually make it worth an extra $200 if it can really hold up to that can of write endurance. http://www.anandtech.com/show/8006/samsung-ssd-xp9...Dug - Friday, December 12, 2014 - link
Ahh ok. Thank you for the response. My fault for not understanding the weight attributed to a certain benchmark.olderkid - Friday, December 12, 2014 - link
Any idea if we're going to see the Samsung SM951 anytime soon? It's all I've been waiting on for a new x99 build.Laststop311 - Saturday, December 13, 2014 - link
Bro i KNOW! I have been on the lookout for sm951 for a long time. When I saw this drive was going to be native pci-e 3.0 x4 m2 ssd + nvme + available in 1TB capacity I was like OMG this is my new drive I dont care what the price is it's 100% goin into my next build. That was like almost 6 months ago or something and still no word. I'm rly sad I hope it is still going to come out.I am not building till Skylake-E so i still have plenty of time. Even tho I am on gulftown i7-980x which is over 4 years old goin on 5 years it still isn't slow enough to be a bottleneck especially on 4.2Ghz OC. Not even upgrading for the cpu just for features I want like DDR4, PCI-E 4.0, ultra m2 slot, sata express, usb 3.0 that isnt from a third party controller (yes I don't have native usb 3.0 still). I still might buy somethign else other than a pc upgrade. This year I bought a 55" oled LG's 2nd gen 55" oled instead of a pc upgrade ( best decision ever it is eye searingly beautiful).
Laststop311 - Saturday, December 13, 2014 - link
3000 for 55" oled = WINpersonne - Friday, December 12, 2014 - link
I'm disappointed no RAID0 SSD setups were included. That's a cost effective option many people will explore which often has comparable performance. Three 850 Pros for 768GB is still less than this device.HoldDaMayo - Friday, December 12, 2014 - link
Well said, I was thinking the exact same thing.Kristian Vättö - Friday, December 12, 2014 - link
I don't have any sets of two drives, so I couldn't include any RAID 0 results here. I may provide an update later if I get my hands on some, though.personne - Friday, December 12, 2014 - link
I've often wondered why these kinds of review sites don't keep databases of results. I realize that the benchmark suites change and you're not a huge operation, but even having recent results to compare openly (using your own front end or even releasing open data) would really up this game and enable your users to participate better. I don't want to sound harsh, but it's 2014, reviewing sites have been around for yearly twenty years and they have changed little in format. Anandtech is easily one of the best, but many sites come down to a few pictures of results and some fairly arbitrary comments (Storage Review is one exception; since the start they've had a database where results can be arbitrarily compared). I hope sooner or later Wikipedia and other collective open benchmarking sites will start elevating comparison and I'd hope to see sites like Anandtech leading the way.Thanks for listening. (=
Kristian Vättö - Friday, December 12, 2014 - link
Well, we've had the Bench section with all of our benchmark data for as long as I can remember.http://www.anandtech.com/bench