Micron M510DC (480GB) Enterprise SATA SSD Review
by Kristian Vättö on July 21, 2015 8:00 AM EST4KB Random Write
Random write is ultimately the benchmark that separates the good from the bad. Read and sequential write operations are rather easy to manage, but a sustained random workload consisting of small IOs will put any SSD down on its knees. The reason lies in NAND architecture because NAND can be programmed at the page level, but erasing can only be done at the block level (usually a few hundred pages). When a drive is subjected to a sustained IO workload, there will inevitably be a point where the drive has to perform garbage collection (read-modify-write cycles) to free up blocks for new host writes, which leads to all SSDs having lower sustained (i.e. steady-state) performance.
Unlike in the client space where workloads are often bursty by nature, enterprise workloads tend to stress the drive 24/7, meaning that the drive effectively operates in steady-state at all times. Hence it's critical to measure enterprise SSD performance only after the drive has reached its steady-state.
Our 4KB random write regime is as follows. To make sure all LBAs have data associated with them, I first run a two-hour 128KB sequential write pass, which accelerates the process of entering steady-state. The fill operation is then followed by a six-hour 4KB random write at queue depth of 32 and all the data (IOPS, standard deviation and power consumption) in the bar graphs are based on the last 500 seconds of that six-hour run. The final step is queue depth scaling, which starts at QD1 and the queue depth increases exponentially with each queue depth being tested for 10 minutes. This whole process is scripted, so there is absolutely no idle time between the tests to ensure that the drive has no time to recover and that we are really measuring worst-case steady-state performance.
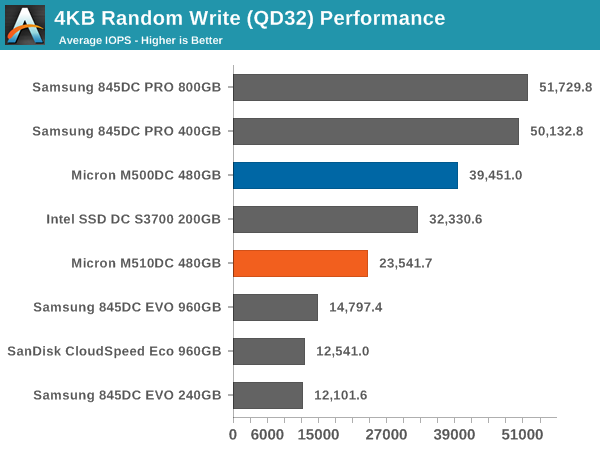
While the M510DC is not particularly designed for write-intensive application, its write performance is significantly better than what competing read-focused drives offer (namely the 845DC EVO and CloudSpeed Eco).
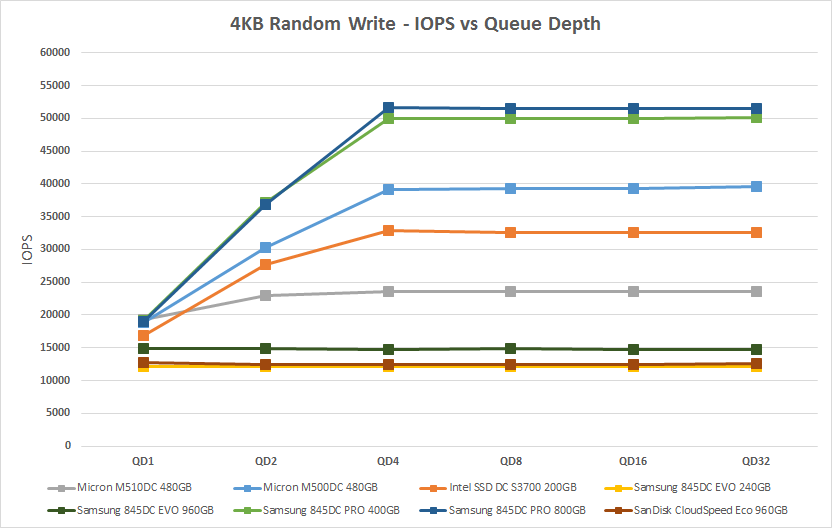
Queue depth scaling doesn't present anything out of the ordinary. All SSDs in our test reach their maximum performance below or at QD4, which is below the intensity of most enterprise workloads.
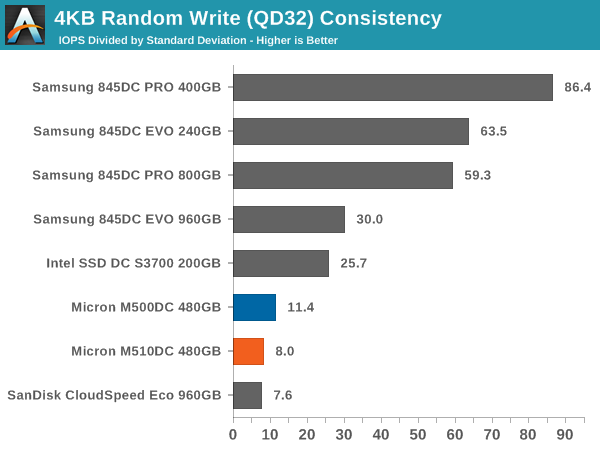
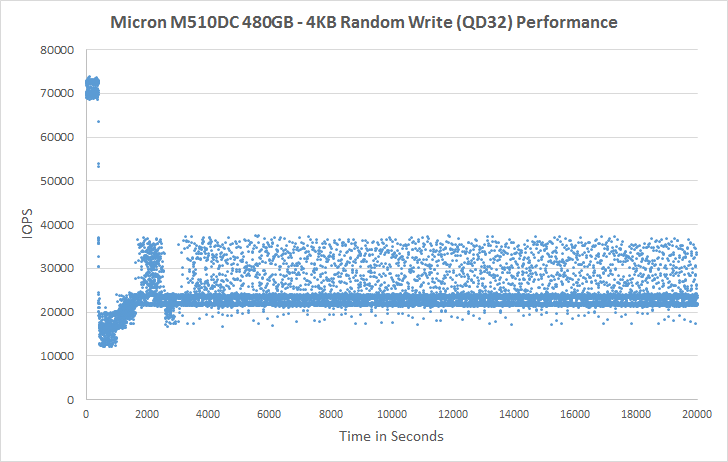
The consistency metric is one that I've been reporting in our client SSD reviews for quite some time now and I think it's a useful metric for measuring both performance and its variation in a simple way. Despite the good average IOPS, the M510DC doesn't appear to be very consistent. That's a shame because I would argue that in the enterprise space consistency is just as important as performance because designing the whole server infrastructure around an inconsistent drive is a difficult and inefficient task. It seems that Samsung is really the one who's dominating in consistency, regardless of the type of NAND.
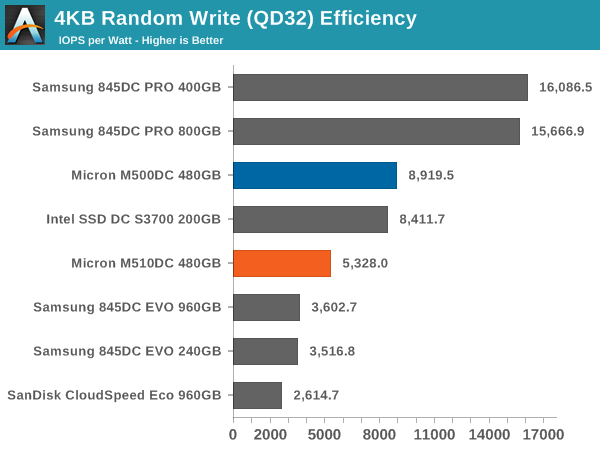
I made power consumption a first-class citizen in our 2015 Client SSD Suite and I'm now doing the same for the enterprise suite. I find the industry as a whole is often too fixated with performance and forgets that performance is just one piece of the puzzle. Power consumption in the enterprise space has a slightly different importance because there is no battery life to worry about, but when there are thousands of drives in a data center, the differences in power efficiencies will show up in the electricity bill, making power consumption a crucial element of the total cost of ownership.
Instead of reporting power as an absolute figure, I'm reporting IOPS per watt, which measures the efficiency of the drive. Power as an absolute number is quite meaningless because a high performance drive may draw more power while being relatively higher in efficiency.
The M510DC is again better than the other entry-level enterprise drives by delivering up to twice the IOPS per watt compared to the CloudSpeed Eco.
 |
|||||||||
| Default | |||||||||
The consistency really is quite bad. Even most client-grade drives have lower variation in performance, although the good news is that there is a fairly steady baseline at ~22K IOPS with the variations mostly being peaks rather than drops in performance. Still, I would like to see better consistency, even if it came at the expense of minor performance loss.
 |
|||||||||
| Default | |||||||||
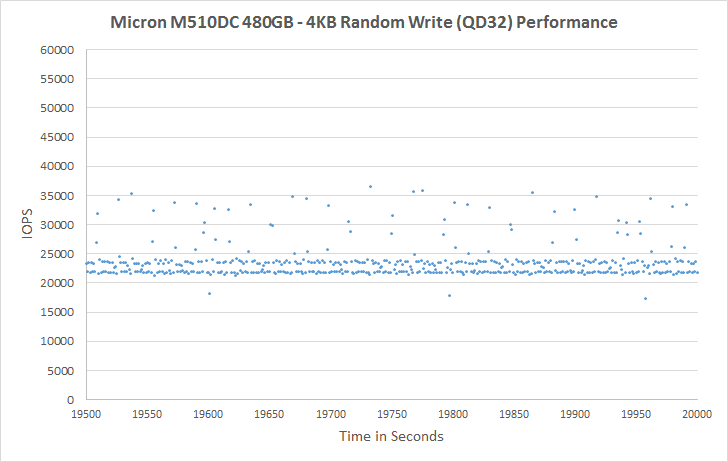
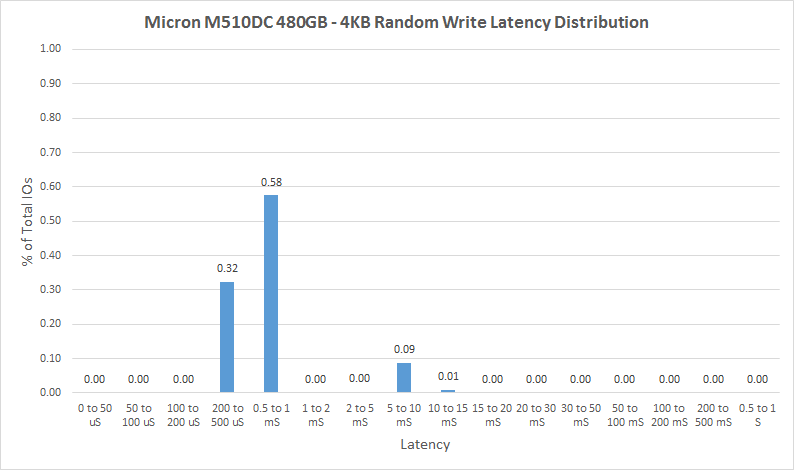
While our performance over time graphs do a good job of characterizing consistency and its variation, ultimately each data point is an average of all IOs occurring during one second. With tens of thousands of IOs being processed each second, the average can easily hide nasty drops in performance. Fortunately, Iometer also reports the number of IOs that occur within certain latency ranges and to get a deeper dive into the drive's behavior I'm reporting the latency distribution during the last 500 seconds of the six-hour run.
 |
|||||||||
| Default | |||||||||
The latency distribution shows a problem in the M510DC right away. A lion share of the IOs have latency below 1ms, which is typically considered to be excellent, but 10% of IOs have >5ms latency. >1ms latency on its own isn't a problem, but jumping from 1ms to up to 10ms is a tenfold increase. That's a hiccup that is significant enough to be noticeable in user performance. For instance the 845DC EVO stays below 5ms, even though it only provides about half of the IOPS the M510DC does.


22 Comments
View All Comments
boe - Saturday, July 25, 2015 - link
Bring on the 10TB SSDs. The 512GB-2TB models have lost all interest for me.thulasiram.valleru - Monday, August 10, 2015 - link
In 4KB IOPS category, Samsung beats against most of its competitors and I am surprised no SSD delivers the speed in category 4KB read and writes as this company with this price range. Any body has a reasonable answer. I am not sure whether in house design and manufacturing of components made it possible for Samsung to achieve the difference.