The Intel Core Ultra 7 155H Review: Meteor Lake Marks A Fresh Start To Mobile CPUs
by Gavin Bonshor on April 11, 2024 8:30 AM ESTASUS Zenbook 14 OLED UX3405MA: Power, System & Storage Performance
As we did in our review of the Razer Blade 14 (2023) gaming notebook, we're also including a pair of desktop chips in our comparison. This includes the AMD Ryzen 7 8700G and Ryzen 5 8600G, which are APUs and are actually based on AMD's Phoenix mobile architecture. This relates to our testing of the AMD Ryzen 9 7940HS, which includes the same Radeon 780M integrated graphics. However, the Ryzen 8000G APUs are adopted for desktops. This allows us to show more data points for our review of Intel's Meteor Lake-based Core Ultra 7 155H to see where performance lies.
Despite including AMD's Phoenix-based Ryzen 8000G APUs in our results, as we expand our list of notebooks tested, we'll have more effective and comparable data points in the future. To add more reference, all of the chips have been tested with Windows 11 22H2.
Power
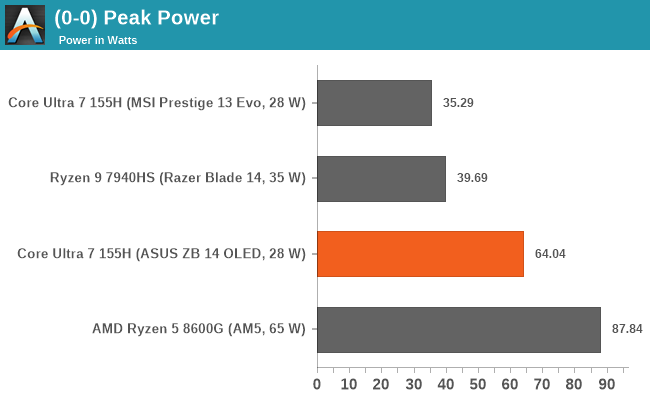
We can see that the peak power value on the Intel Core Ultra 7 155H-equipped ASUS laptop hits just below 65 W, which is Intel's minimum assured power (MAP) value for this specific chip. Although the Intel Core Ultra 7 155H has a maximum turbo TDP of 115 W, which is entirely dependent on the mobile manufacturer to implement, and such is the case of the ASUS Zenbook 14 OLED UX3405MA ultrabook, it is too thin and light on cooling to be able to cater to such high power draw. For the purposes of this review, we've limited the Ryzen 9 7940HS to its base TDP of 35 W, which means there will be some variance depending on the workload, which can range up to 39 W.
(Click to enlarge)
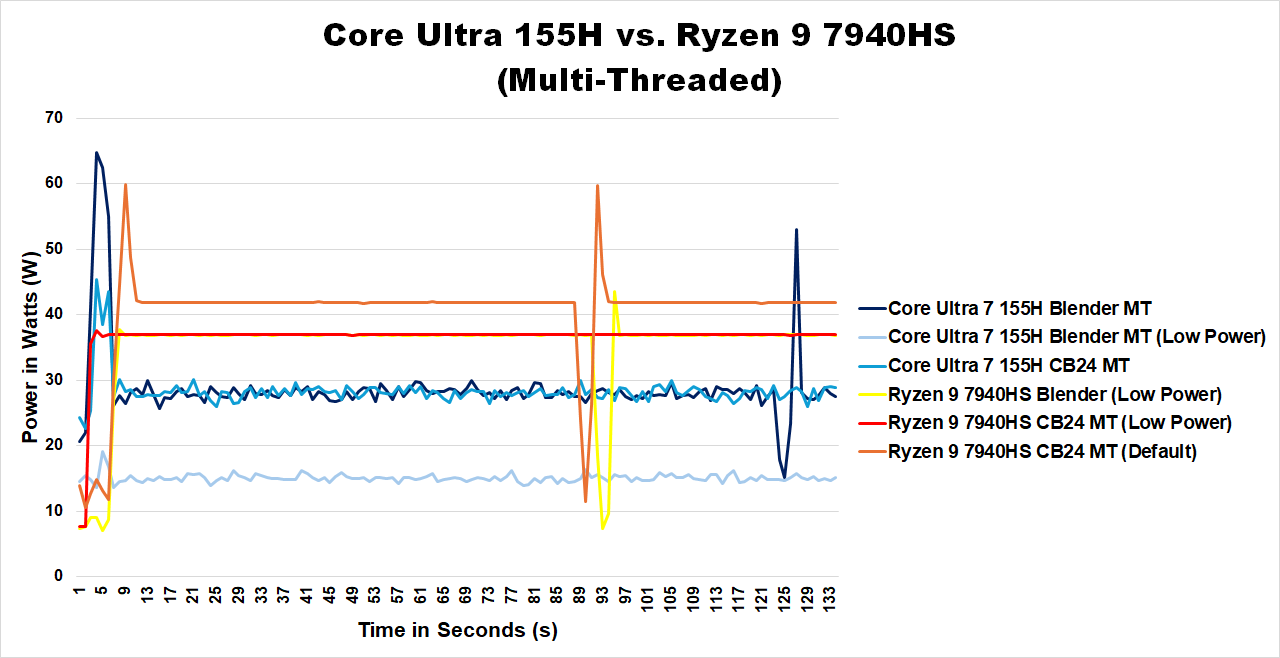
We can see something very interesting by looking more in-depth at the Intel Core Ultra 7 155H power within the ASUS Zenbook 14 OLED. Using the latest CineBench 2024 rendering benchmark on a loop with the multi-threaded test selected, we can see that the Core Ultra 7 155H hits thermal and power throttling very quickly. Within five seconds of the start of the benchmark, the Core Ultra 7 155H peaks around 64-65 W. It then quickly ramps down to between 28 and 30 W, which is around the base TDP of the chip, which Intel rates at 28 W. This means the chip is throttling by more than half of the 65 W maximum assured power rating Intel has given this chip.
Another thing we can see from our power testing is that the Ryzen 9 7940HS, at the default settings, operates at a higher power than the Core Ultra 7 155H over a prolonged period. To make performance comparisons fairer where we can, we put the Razer Blade 14 into silent mode, which reduced the power of the Ryzen 9 7940HS down to around 39 W for sustained load. This chip isn't overclockable, so there's no viable way to control power consumption.
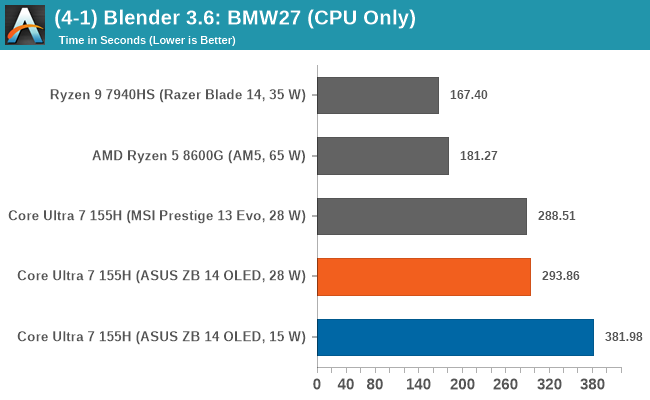
Using the low power mode, which ASUS officially calls 'whisper mode' on the ASUS Zenbook 14 OLED, we can see this reduces power massively with a peak of 19 W before settling quickly to a consistent 14-15 W range. As we can see in the above Blender 3.6 data, the whisper mode and a lower power profile applied to the Core Ultra 7 155H prove ineffective regarding workload performance. The Ryzen 7940HS also exhibits similar behavior in multi-threaded workloads, peaking at 45 W before quickly settling down to a very consistent mark of around 38-39 W throughout the benchmark.
Ultimately, this helps to properly characterize the power characteristics of our sample laptops. While both the Intel and AMD chips have overlapping TDPs, the Razer Blade that the Ryzen chip sits in is very clearly built and tuned for higher sustained power than the thin-and-light ASUS ultrabook. So we never have an entirely apples-to-apples testing scenario, though short of putting both chips in the same chassis, that would always be the case. That being said, we have tried to limit the power on the Ryzen 9 7940HS to its base TDP of 35 W, just to make things a little more fairer.
As for the Zenbook in particular, this tells us that its cooling isn't enough to provide enough capability to sustain high power in multi-threaded workloads, at least not in line with Intel's 65 W value for maximum assured power. While it's true that different types of workloads are more intensive than others, and CineBench 2024 MT is considered a heavy test, we're effectively showing the worst-case scenario here for the Core Ultra 7 155H. That means that results may vary in different multi-threaded workloads and with different models of notebooks with different levels of cooling.
(Click to enlarge)
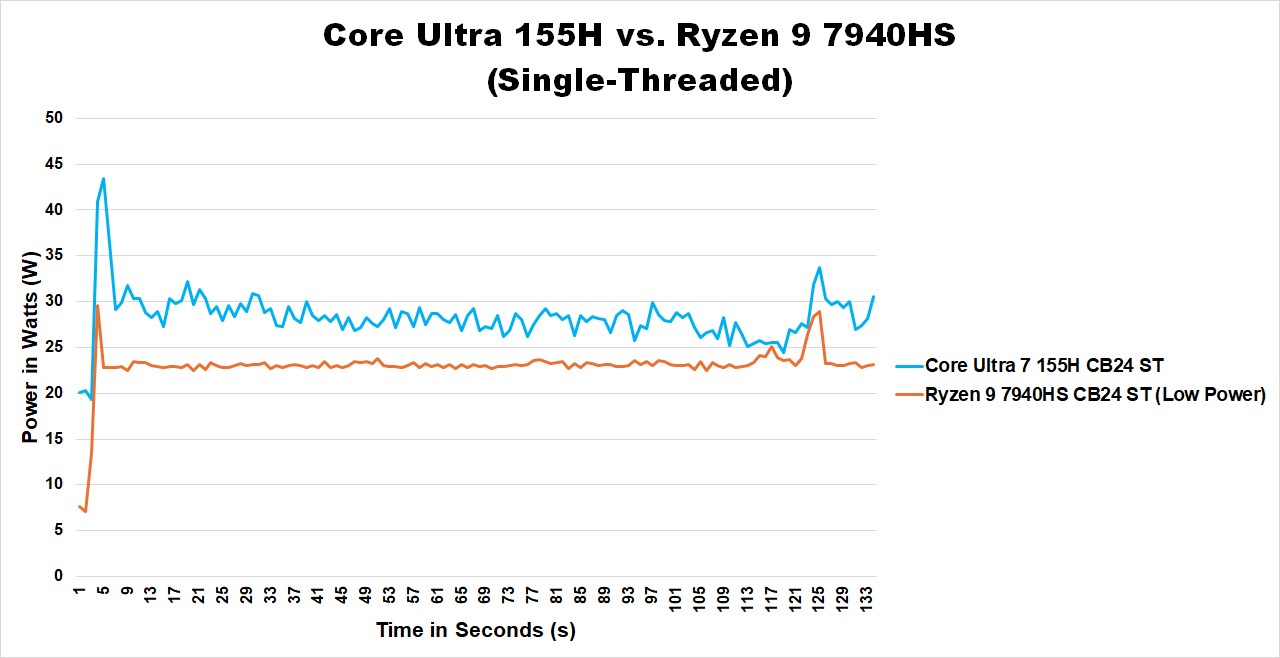
Looking at single-threaded power consumption in CineBench 2024, the Core Ultra 7 155H peaks at around 43 W before ramping down to a semi-consistent power range of between 27 and 30 W. The AMD Ryzen 9 7940HS is more power efficient than Intel's Meteor Lake architecture in single-threaded performance, with a quick ramp up to around 41 W and then an ultra-consistent value of between 23 and 24 W. How that translates into performance in our benchmark suite for 2024 shapes up to be a battle of Intel's Core Ultra 7 155H at a sustained 28 W, versus the AMD Ryzen 9 7940HS that we forced to run at base TDP (35 W) at around 29 W in single-threaded applications.
Web & Office
The next section of our updated notebook test suite is web and office-based tests. Our updated notebook suite runs in parallel with our current CPU test suite for 2023. It allows us to blend mobile chips tested with desktop chips, mainly to see efficiency and performance levels and how they stack up for each generation we try.
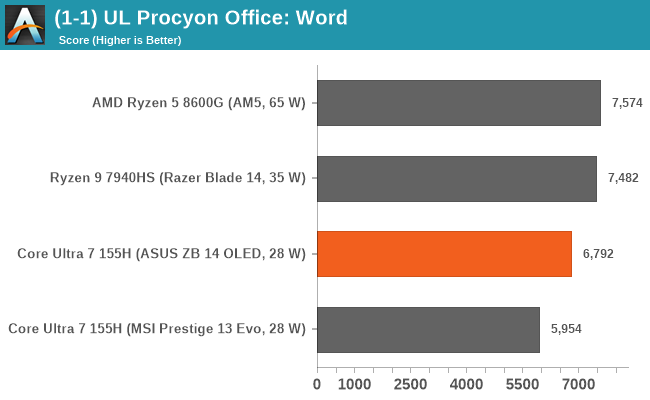
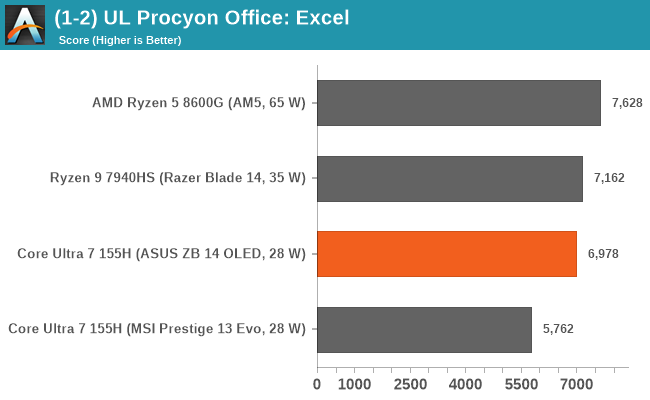
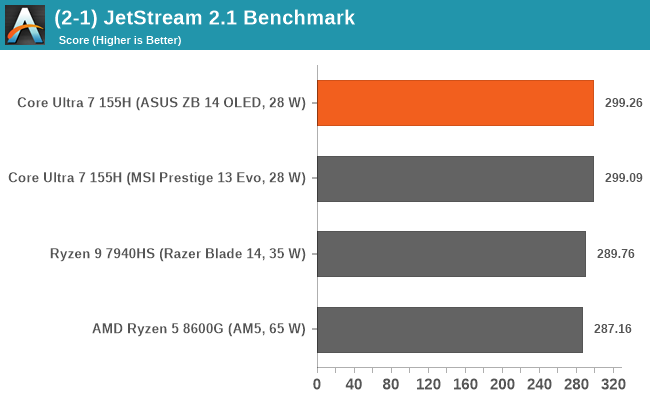
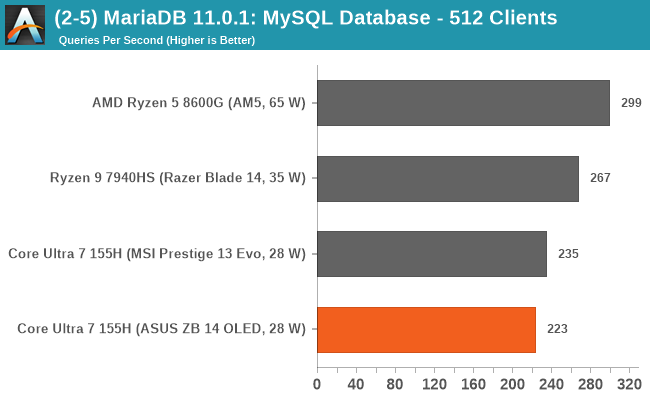
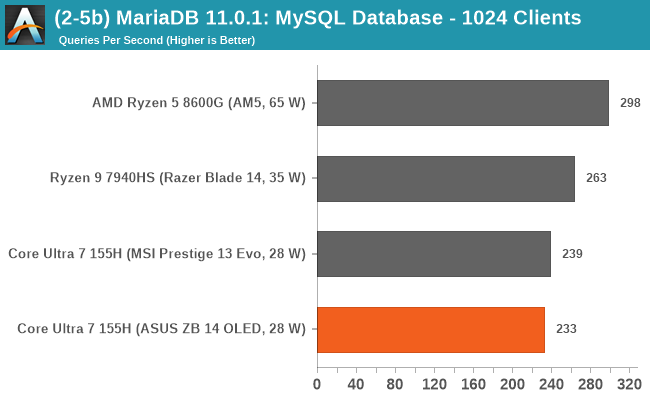
Looking at performance in our web and office-based testing, in the UL Procyon Office-based tests using Microsoft Office, the Core Ultra 7 155H is competitive but lags behind the AMD chips slightly. Meteor Lake does very well in the web-based Jetstream 2.1 benchmark, even outperforming the desktop-based Ryzen 8000G APU pairing. We see a different story in our MariaDB MySQL database benchmarks, although performance is still relatively competitive compared to the AMD chips we've tested.
Storage
Storage performance is dictated by more than just putting in the fastest drive you can; other variables include the interface used, the quality of the controller, and the overall drive. The ASUS Zenbook 14 OLED UX3405MA includes a 1 TB drive, which is labeled as a Western Digital WD560 NVMe drive. It has a PCIe 4.0 x2 interface, which means its performance is similar to that of a PCIe 3.0 x 4 M.2 drive.
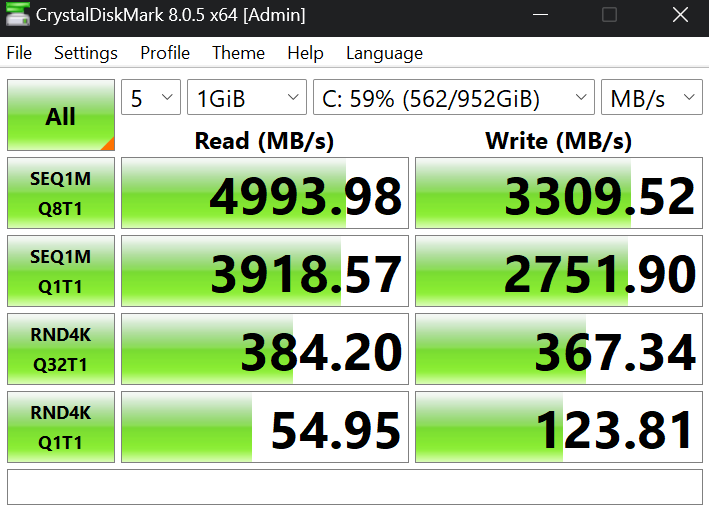
Unfortunately, we couldn't find any official specifications for the Western Digital WD560 NVMe SSD. However, as we can see in CrystalDiskMark, we are seeing sequential read speeds of just under 5000 MB/s with sequential write performance of around 3300 MB/s. This is still good raw throughput performance for an ultrabook such as the ASUS Zenbook 14 UX3405MA, although this will differ between both compressed and uncompressed data.
When judging and measuring storage performance, it comes down to real-world performance and ensuring optimal cooling, especially on these fast NVMe drives, which can run very hot and thermally throttle, reducing performance.
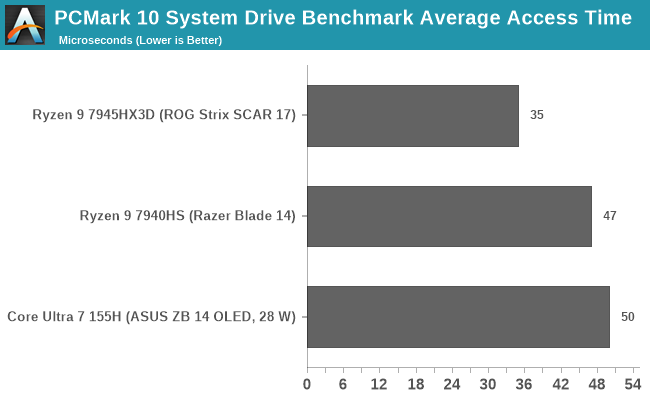
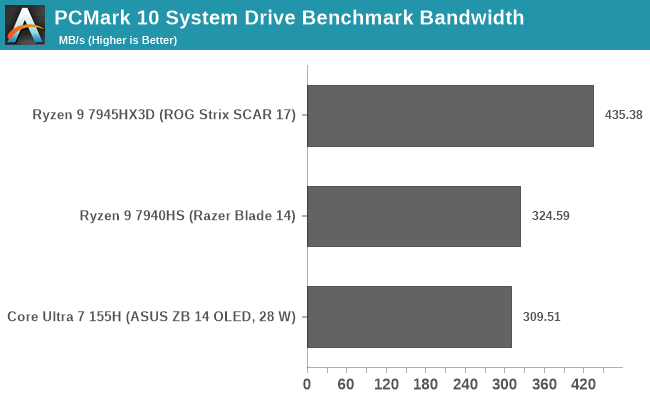
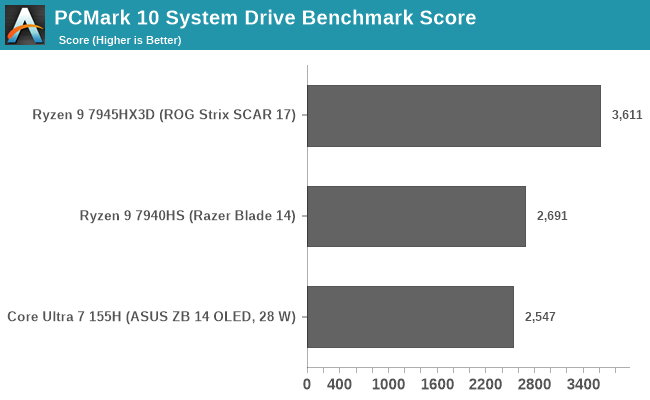
Using the storage benchmark built into PCMark 10, we can see that the ASUS Zenbook 14 UX3405 and the WD560 1 TB SSD being used are somewhat inferior to drives in other similar notebooks we've tested. For storage, we've included the ASUS ROG Strix SCAR 17, which is a desktop replacement model and ultimately has the best-in-class storage it can accommodate.
Even compared to the MSI Prestige 13 AI Evo A1MG notebook, which also has an Intel Meteor Lake Core Ultra 7 155H installed, the storage performance of the ASUS Zenbook 14 OLED isn't up to the same level.


69 Comments
View All Comments
Dante Verizon - Thursday, April 11, 2024 - link
Too strange... in the spec2017 test that represents Blender MeteorLake wins but in the real Blender test it loses? GreatDante Verizon - Thursday, April 11, 2024 - link
The iGPU performance of desktop APUs is also abnormally low.Gavin Bonshor - Friday, April 12, 2024 - link
Could you please elaborate? Did another publication's results land higher? Did they run JEDEC memory settings?ballsystemlord - Thursday, April 11, 2024 - link
That near 50% increase in DRAM access latency coupled with the higher thermal limitations is probably what's holding the 115H back.Ryan Smith - Thursday, April 11, 2024 - link
Keep in mind that they're different workloads with different versions of Blender. The version in SPEC2017 is from 7 years ago, which was the Blender 2.7 era.mode_13h - Monday, April 15, 2024 - link
spec2017 is using an old version of Blender that's frozen in time. That's needed to make all spec2017 results comparable with each other.In the individual Rendering benchmarks, Gavin used a reasonably current version of Blender (3.6 is a LTS release from June 27, 2023), probably also built with a different compiler.
Hulk - Thursday, April 11, 2024 - link
"AMD Arc" in GPU specs?Gavin Bonshor - Friday, April 12, 2024 - link
Yeah, that was a really weird one. It has since been corrected.Fozzie - Thursday, April 11, 2024 - link
Why is the text seemingly out of line with the actual results? Repeatedly it is describing wins for the U7 155H that don't seem to be backed up in the actual benchmarks. For example:"As we can see from our rendering results, the Intel Core Ultra 7 155H is very competitive in single-threaded performance and is ahead of AMD's Zen 4 mobile Phoenix-based Ryzen 9 7940HS."
Actually, the graphs don't show a single instance of the Ultra 7155H besting the Ryzen 9 7940HS in ALL of the preceding graphs.
"Looking at performance in our web and office-based testing, in the UL Procyon Office-based tests using Microsoft Office, the Core Ultra 7 155H is actually outperforming the AMD Ryzen 9 7940HS, which is a good win in itself."
How is 6,792 greater than 7,482? How is 6,978 higher than 7,162?
Did the benchmarks get updated after the text was written? Did someone write the summary text and not pay attention to "Higher is better" vs "Lower is better"?
phoenix_rizzen - Thursday, April 11, 2024 - link
The text describing the Spec tests are also incorrect."Even though the Core Ultra 7 155H is technically an SoC, it remains competitive in the SPECint2017 section of our single-thread testing against the Ryzen 9 7940HS. The AMD chip performs better in two of the tests (525.x264_r and 548.exchange2_r); on the whole, Intel is competitive."
Except the graph shows the AMD system beating the Intel system in 7 tests and only losing by a small margin in 3 of them. The AMD system even beats the Intel desktop system in 4 tests and ties it in 1.
"In the second section of our single-threaded testing, we again see a very competitive showing in SPECfp2017 between the Intel Core Ultra 7 155H and the AMD Ryzen 9 7940HS. The only test we see a major gain for the Ryzen 9 7940HS is in the 503.bwaves_r test, which is a computational fluid dynamics (CFD) simulation."
Except the AMD system wins in 4 tests, essentially ties in 5 tests, and only loses in 2. It even beat the desktop system in 3 tests.
The text is nowhere near consistent with the graphs.