SanDisk Professional PRO-G40 Thunderbolt / USB Dual-Mode Portable SSD Review
by Ganesh T S on October 6, 2022 8:00 AM ESTPCMark 10 Storage Bench - Real-World Access Traces
There are a number of storage benchmarks that can subject a device to artificial access traces by varying the mix of reads and writes, the access block sizes, and the queue depth / number of outstanding data requests. We saw results from two popular ones - ATTO, and CrystalDiskMark - in a previous section. More serious benchmarks, however, actually replicate access traces from real-world workloads to determine the suitability of a particular device for a particular workload. Real-world access traces may be used for simulating the behavior of computing activities that are limited by storage performance. Examples include booting an operating system or loading a particular game from the disk.
PCMark 10's storage bench (introduced in v2.1.2153) includes four storage benchmarks that use relevant real-world traces from popular applications and common tasks to fully test the performance of the latest modern drives:
- The Full System Drive Benchmark uses a wide-ranging set of real-world traces from popular applications and common tasks to fully test the performance of the fastest modern drives. It involves a total of 204 GB of write traffic.
- The Quick System Drive Benchmark is a shorter test with a smaller set of less demanding real-world traces. It subjects the device to 23 GB of writes.
- The Data Drive Benchmark is designed to test drives that are used for storing files rather than applications. These typically include NAS drives, USB sticks, memory cards, and other external storage devices. The device is subjected to 15 GB of writes.
- The Drive Performance Consistency Test is a long-running and extremely demanding test with a heavy, continuous load for expert users. In-depth reporting shows how the performance of the drive varies under different conditions. This writes more than 23 TB of data to the drive.
Despite the data drive benchmark appearing most suitable for testing direct-attached storage, we opt to run the full system drive benchmark as part of our evaluation flow. Many of us use portable flash drives as boot drives and storage for Steam games. These types of use-cases are addressed only in the full system drive benchmark.
The Full System Drive Benchmark comprises of 23 different traces. For the purpose of presenting results, we classify them under five different categories:
- Boot: Replay of storage access trace recorded while booting Windows 10
- Creative: Replay of storage access traces recorded during the start up and usage of Adobe applications such as Acrobat, After Effects, Illustrator, Premiere Pro, Lightroom, and Photoshop.
- Office: Replay of storage access traces recorded during the usage of Microsoft Office applications such as Excel and Powerpoint.
- Gaming: Replay of storage access traces recorded during the start up of games such as Battlefield V, Call of Duty Black Ops 4, and Overwatch.
- File Transfers: Replay of storage access traces (Write-Only, Read-Write, and Read-Only) recorded during the transfer of data such as ISOs and photographs.
PCMark 10 also generates an overall score, bandwidth, and average latency number for quick comparison of different drives. The sub-sections in the rest of the page reference the access traces specified in the PCMark 10 Technical Guide.
Booting Windows 10
The read-write bandwidth recorded for each drive in the boo access trace is presented below.
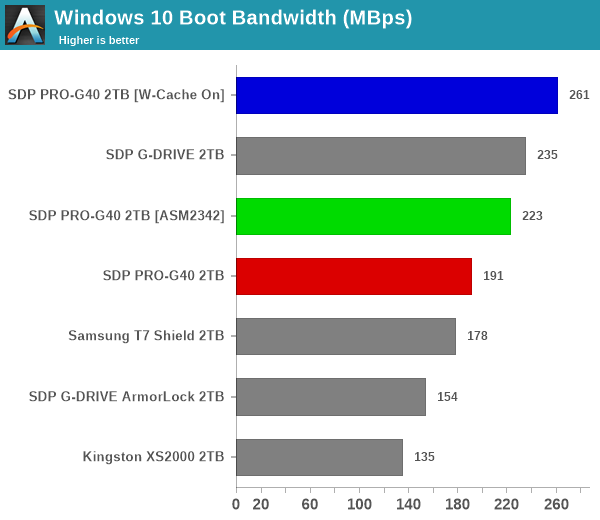
It is surprising to note that enabling write caching on the storage device has a significant effect on the boot performance. While the workload is definitely read-heavy, the ability of the PSSD to absorb small random writes quickly can result in a significant boost. The raw bandwidth available doesn't seem to have much of an effect, as we see the device performing better when connected via the 10Gbps path compared to the 40Gbps one.
Creative Workloads
The read-write bandwidth recorded for each drive in the sacr, saft, sill, spre, slig, sps, aft, exc, ill, ind, psh, and psl access traces are presented below.
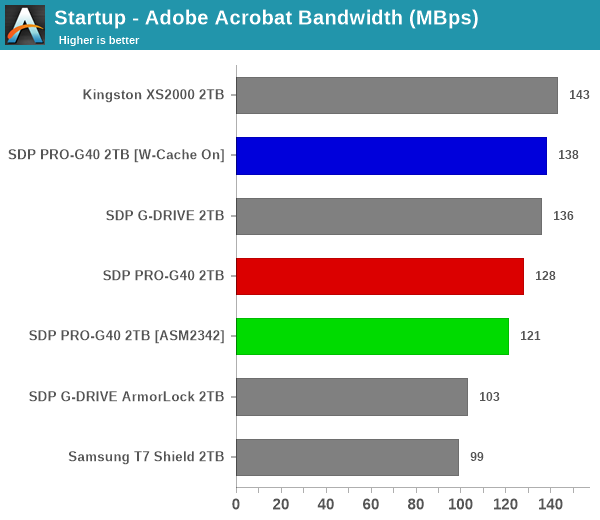
The Thunderbolt 3 PSSD with write caching on is a top performer in creative workloads, as one might expect from the SanDisk Professional brand. There are a few components where the Kingston XS2000 with its Gen 2x2 interface sneaks ahead. By and large, though, the PRO-G40 delivers results that are expected from it. The default Thunderbolt 3 PSSD setting of write caching off is a different story - in some components, it performs worse than the PRO-G40 connected via a 10 Gbps interface.
Office Workloads
The read-write bandwidth recorded for each drive in the exc and pow access traces are presented below.
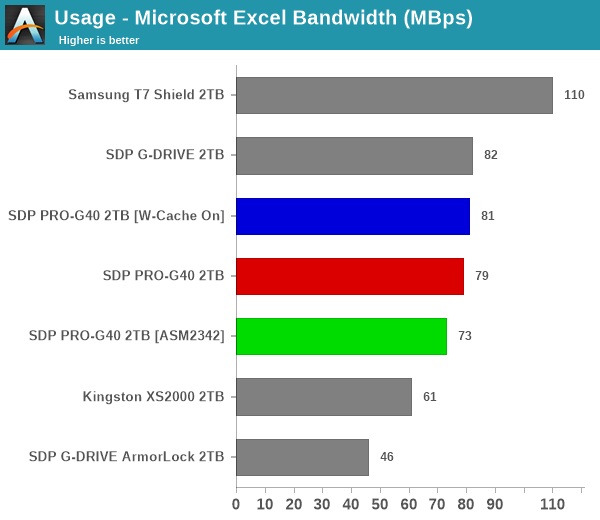
The write caching setting again plays a notable role in the Thunderbolt mode. Under default conditions, the Thunderbolt mode actually performs a bit worse than the 10Gbps mode.
Gaming Workloads
The read-write bandwidth recorded for each drive in the bf, cod, and ow access traces are presented below.
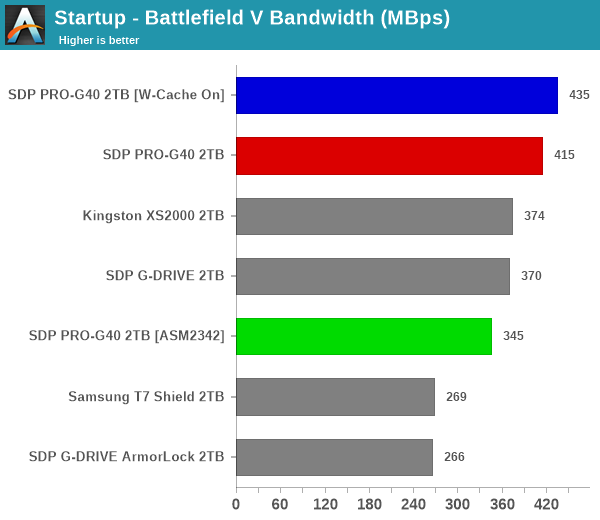
These are read-intensive workloads with token writes that the write caching setting can easily handle to provide top-of-the-line performance. The distribution of transfers is such that the 10Gbps connection again provides better performance compared to default Thunderbolt mode for certain games.
Files Transfer Workloads
The read-write bandwidth recorded for each drive in the cp1, cp2, cp3, cps1, cps2, and cps3 access traces are presented below.
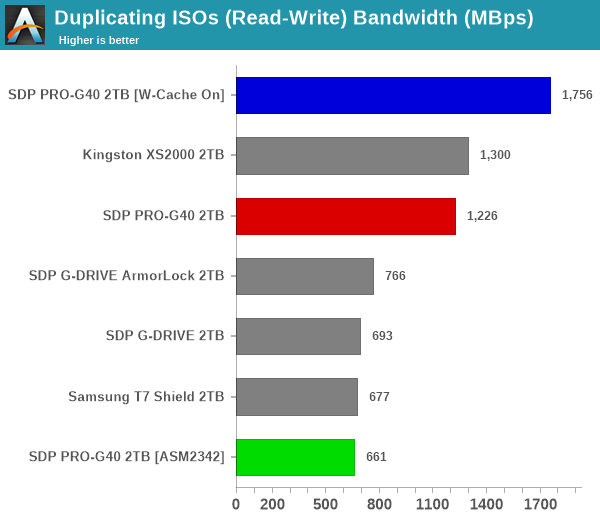
File transfer workloads deal mainly with large-sized writes, and it is no surprise then that Thunderbolt mode with write caching on is a top performer across the board. The PSSDs with a 10Gbps connection make up the bottom half of the graphs, but that is no surprise based on the size distribution of the transfers.
Overall Scores
PCMark 10 reports an overall score based on the observed bandwidth and access times for the full workload set. The score, bandwidth, and average access latency for each of the drives are presented below.
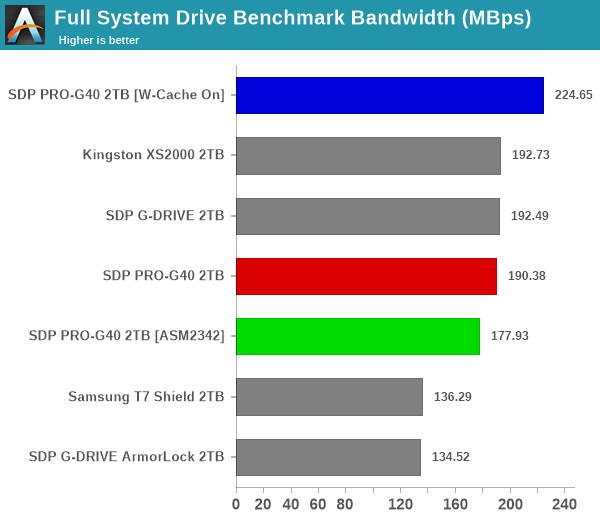
The overall scores are along expected lines - the Thunderbolt 3 mode with write caching on performs on par with a premium PCIe Gen 3.0 x4 internal SSD, while the other PSSD configurations / host connections follow well behind in terms of both bandwidth and latency.


13 Comments
View All Comments
mikegrok - Tuesday, October 11, 2022 - link
So, it is a SSD with mediocre performance, will not thermally throttle, and will survive a trip through the washing machine.mikegrok - Wednesday, October 12, 2022 - link
It could be good for travel photographers, ie while loading the sea plane your camera bag gets dropped in the water, your photos don't get lost.schmadde - Saturday, November 5, 2022 - link
Mediocre performance? What other external TB drives do you know that are faster?