The Intel Core Ultra 7 155H Review: Meteor Lake Marks A Fresh Start To Mobile CPUs
by Gavin Bonshor on April 11, 2024 8:30 AM ESTSPEC2017 Single And Multi-Threaded Results
Update 04/12/24: We are currently re-running SPEC2017 on the Intel Core i5-14600K, and we will update the results accordingly once we have them. Apologies for any inconvenience.
SPEC2017 is a series of standardized tests used to probe the overall performance between different systems, different architectures, different microarchitectures, and setups. The code has to be compiled, and then the results can be submitted to an online database for comparison. It covers a range of integer and floating point workloads, and can be very optimized for each CPU, so it is important to check how the benchmarks are being compiled and run.
We run the tests in a harness built through Windows Subsystem for Linux, developed by Andrei Frumusanu. WSL has some odd quirks, with one test not running due to a WSL fixed stack size, but for like-for-like testing it is good enough. Because our scores aren’t official submissions, as per SPEC guidelines we have to declare them as internal estimates on our part.
For compilers, we use LLVM both for C/C++ and Fortan tests, and for Fortran we’re using the Flang compiler. The rationale of using LLVM over GCC is better cross-platform comparisons to platforms that have only have LLVM support and future articles where we’ll investigate this aspect more. We’re not considering closed-source compilers such as MSVC or ICC.
clang version 10.0.0

clang version 7.0.1 (ssh://git@github.com/flang-compiler/flang-driver.git

 24bd54da5c41af04838bbe7b68f830840d47fc03)
-Ofast -fomit-frame-pointer

-march=x86-64

-mtune=core-avx2

-mfma -mavx -mavx2
Our compiler flags are straightforward, with basic –Ofast and relevant ISA switches to allow for AVX2 instructions.
To note, the requirements for the SPEC license state that any benchmark results from SPEC have to be labeled ‘estimated’ until they are verified on the SPEC website as a meaningful representation of the expected performance. This is most often done by the big companies and OEMs to showcase performance to customers, however is quite over the top for what we do as reviewers.
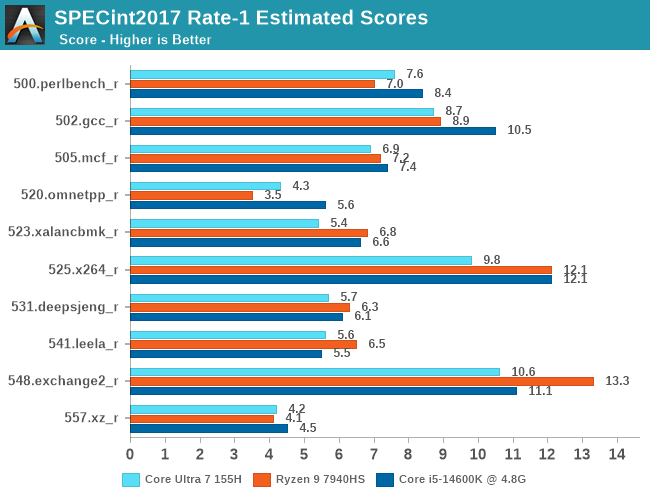
Starting with the single-threaded results in SPECint2017 and comparing the Intel Core Ultra 7 155H directly to AMD's Ryzen 9 7940HS processor, we can see that both chips are relatively competitive for the most part. Since Intel's Core Ultra 7 155H is based on their Meteor Lake SoC with the compute tile built on the latest Intel 4 process, Intel has done a good job of ensuring parity with the competition. Even though the Core Ultra 7 155H is technically an SoC, it remains competitive in the SPECint2017 section of our single-thread testing against the Ryzen 9 7940HS. The AMD chip performs better in two of the tests (525.x264_r and 548.exchange2_r); on the whole, Intel is competitive.
In order to try to keep things a little more apples-to-apples in this architecture-centric benchmark set, we've capped the Intel Core i5-14600K to the same boost core frequencies as the Core Ultra 7 155H (4.8 GHz P-Core and 3.8 GHz E-Core), as well as explicitly enforcing Intel's stock power specifications to avoid motherboard boosting via Multi-Core Enhancement. Doing so, we see similar levels of single-threaded performance as the other chips.
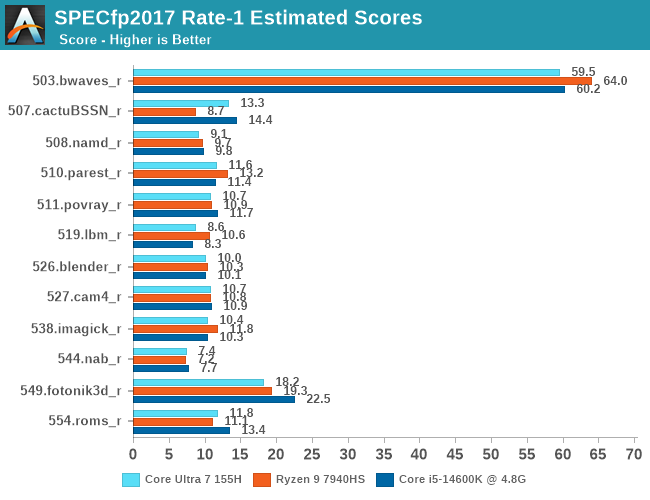
In the second section of our single-threaded testing, we again see a very competitive showing in SPECfp2017 between the Intel Core Ultra 7 155H and the AMD Ryzen 9 7940HS. The only test we see a major gain for the Ryzen 9 7940HS is in the 503.bwaves_r test, which is a computational fluid dynamics (CFD) simulation.
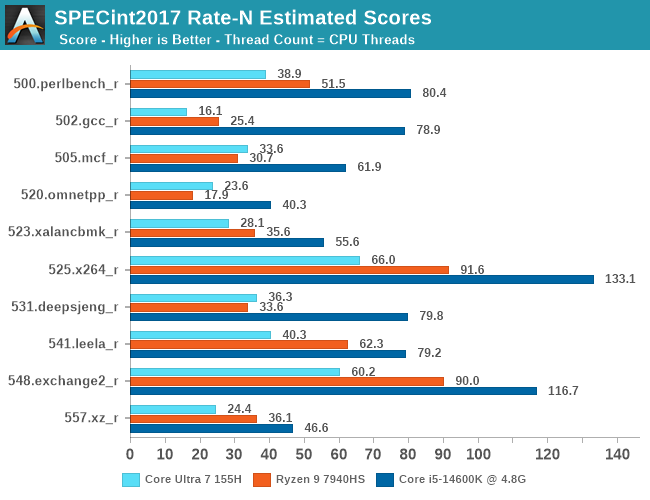
Moving onto the multi-threaded section of our SPEC2017 testing, things get considerably different. First of all, the Intel Core Ultra 7 155H has more cores than the Ryzen 9 7940HS (6P+8E+2LP vs. 8C), but ultimately, the Ryzen 9 7940HS uses more of the bigger cores. The Core Ultra 7 155H resembles the U-series Phoenix-based AMD chips like the Ryzen 7 7840U. Taking that into consideration, we can see that the Ryzen 9 7940HS performs considerably better than the Core Ultra 7 155H in the multi-threaded tests, with wins in all but two of the tests, which are 502.gcc_r and 505.mcf_r, where Intel gets modest wins. In this area, the Intel Core i5-14600K has superior multi-threaded performance, but as it is a chip built on a fully desktop architecture, this is expected.
Analyzing the Core i5-14600K in relation to the Core Ultra 7 155H, we see the desktop variant of Raptor Lake consistently outperforming the chips. Even with our frequency capping, the desktop chip's power and cooling advantage can't be completely nullified, so while it provides a useful baseline, Core Ultra isn't going to beat a 125 Watt desktop chip in multi-threaded workloads any time soon – especially when Core Ultra still has to worry about being energy efficient overall.

In the second section of our SPEC2017 MT testing, the SPECfp2017 section also shows more wins for AMD than Intel. In the 503.bwaves_r (CFD) test, the Ryzen 9 7940HS is around 35% ahead of the Core Ultra 7 155H. Intel's Meteor Lake SoC does take wins in the 519.lbm_r and 526.blender_r tests and is competitive in a couple of the tests, but overall, the Ryzen 9 7940HS has more in terms of multi-threaded performance across the majority of the SPEC2017 MT suite.
It's also worth noting here that for our SPEC2017 testing, unlike desktop chips with motherboard vendors looking to outdo each other in performance, it inherently allows for more power to be given to the processor. We are at the whim of tighter power constraints in the case of mobile processors, including notebooks. In a light and thin notebook, such as the ASUS Zenbook 14 OLED UX3405MA, which we are using for our testing, there are both power and thermal constraints to deal with, and it does reflect somewhat in our testing. We can only test with what we have at hand within the range of capabilities the delivery vehicle offers us.


69 Comments
View All Comments
Gavin Bonshor - Friday, April 12, 2024 - link
I refer to it as a major gain; the other victories weren't huge. That was my point Replysjkpublic@gmail.com - Thursday, April 11, 2024 - link
Comparing the 155H to the 7940HS is apples to oranges. A better comparison would be the 185H. ReplyBigos - Thursday, April 11, 2024 - link
What happened to SPECint rate-N 502.gcc_r results? I do not believe desktop Raptor Lake is 16-40x faster than the mobile CPUs... ReplySarahKerrigan - Thursday, April 11, 2024 - link
No, something is clearly wrong there. I deal with SPEC a lot for work and that's an abnormally low result unless it was actually being run in rate-1 mode (ie, someone forgot to properly set the number of copies.) ReplyGavin Bonshor - Friday, April 12, 2024 - link
I am currently investigating this. Thank you for highlighting it. I have no idea how I missed this. I can only apologize Replymode_13h - Monday, April 15, 2024 - link
While we're talking about SPEC2017 scores, I'd like to add that I really miss the way your reviews used to feature the overall cumulative SPECfp and SPECint scores. It was useful in comparing overall performance, both of the systems included in your review and those from other reviews.To see what I mean, check out the bottom of this page: https://www.anandtech.com/show/17047/the-intel-12t... Reply
Ryan Smith - Monday, April 15, 2024 - link
That's helpful feedback. It's a bit late to add it to this article, but that's definitely something I'll keep in mind for the next one. Thanks! Replymode_13h - Wednesday, April 17, 2024 - link
You're quite welcome!BTW, I assume there's a "standard" way that SPEC computes those cumulative scores. Might want to look up how they do it, if the benchmark doesn't just compute them for you. If you come up with your own way of combining them, your cumulative scores probably won't be comparable to anyone else's. Reply
Ryan Smith - Wednesday, April 17, 2024 - link
"BTW, I assume there's a "standard" way that SPEC computes those cumulative scores."Yes, there is. We don't run all of the SPEC member tests for technical reasons, so there is some added complexity there. Reply
mczak - Thursday, April 11, 2024 - link
Obviously, the cluster topology description is wrong in the core to core latency measturements section, along with the hilarious conclusion the first two E-cores having only 5 ns latency to each other. (First two threads of course belong to a P-core, albeit I have no idea why the core enumeration is apparently 1P-8E-5P-2LPE.) Reply