Memory Frequency Scaling in SFF Systems: An Investigation with SO-DIMMs and Coffee Lake
by Ganesh T S on November 28, 2018 8:00 AM ESTUL Benchmarks - PCMark and 3DMark
This section deals with a selection of the UL Futuremark benchmarks - PCMark 10, PCMark 8, and 3DMark. While the first two evaluate the system as a whole, 3DMark focuses on the graphics capabilities.
PCMark 10
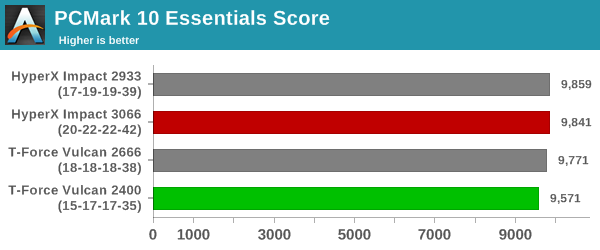
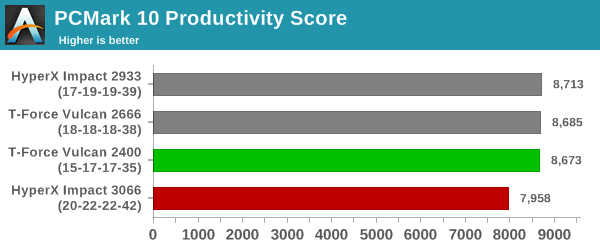
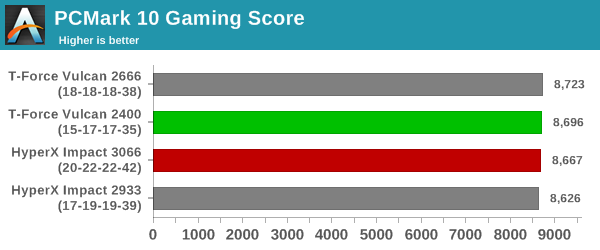
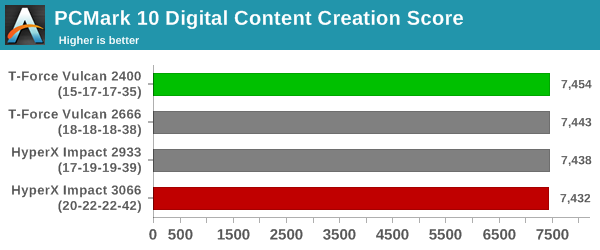
UL's PCMark 10 evaluates computing systems for various usage scenarios (generic / essential tasks such as web browsing and starting up applications, productivity tasks such as editing spreadsheets and documents, gaming, and digital content creation). We benchmarked select PCs with the PCMark 10 Extended profile and recorded the scores for various scenarios. These scores are heavily influenced by the CPU and GPU in the system, though the RAM and storage device also play a part. The power plan was set to Balanced for all the PCs while processing the PCMark 10 benchmark.
The DDR4-2933 seems to perform better than the other configurations in general. However, the scores really don't vary that much across the different configurations for each scenario.

PCMark 8
We continue to present PCMark 8 benchmark results (as those have more comparison points) while our PCMark 10 scores database for systems grows in size. PCMark 8 provides various usage scenarios (home, creative and work) and offers ways to benchmark both baseline (CPU-only) as well as OpenCL accelerated (CPU + GPU) performance. We benchmarked select PCs for the OpenCL accelerated performance in all three usage scenarios. These scores are heavily influenced by the CPU in the system.
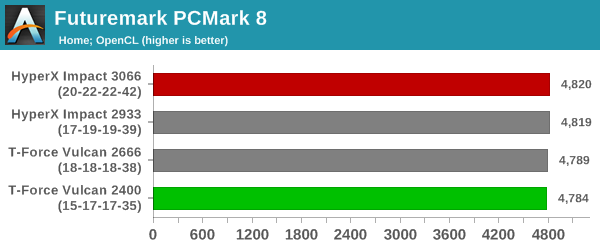
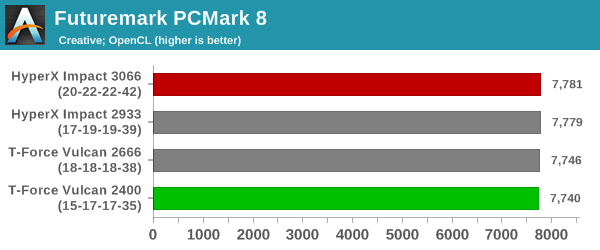
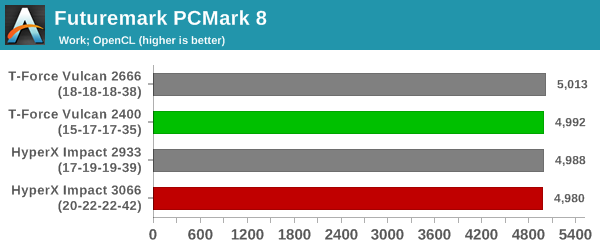
The scores are bunched together for the most part, and a clear delineation between the different configurations is hard to find.
3DMark
UL's 3DMark comes with a diverse set of graphics workloads that target different Direct3D feature levels. Correspondingly, the rendering resolutions are also different. We use 3DMark 2.4.4264 to get an idea of the graphics capabilities of the system. In this section, we take a look at the performance of the ASRock DeskMini Z370 GTX configurations across the different 3DMark workloads.
Since the main system RAM characteristics don't affect GPU-limited workloads, we expect that most benchmark scores are going to be the same for all the tested configurations. There may be some graphics workloads that are CPU / CPU-memory bandwidth limited, but, such characteristics may be hard to target with the GPU-limited 3DMark workloads.
3DMark Ice Storm
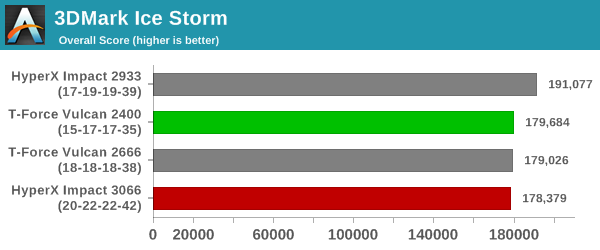
This workload has three levels of varying complexity - the vanilla Ice Storm, Ice Storm Unlimited, and Ice Storm Extreme. It is a cross-platform benchmark (which means that the scores can be compared across different tablets and smartphones as well). All three use DirectX 11 (feature level 9) / OpenGL ES 2.0. While the Extreme renders at 1920 x 1080, the other two render at 1280 x 720. The graphs below present the various Ice Storm workloads' numbers for different configurations that we have evaluated.
| UL 3DMark - Ice Storm Workloads | |||
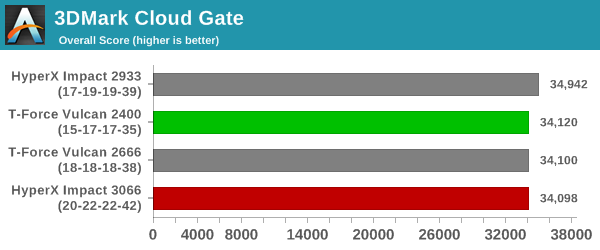
3DMark Cloud Gate
The Cloud Gate workload is meant for notebooks and typical home PCs, and uses DirectX 11 (feature level 10) to render frames at 1280 x 720. The graph below presents the overall score for the workload across all the systems that are being compared.
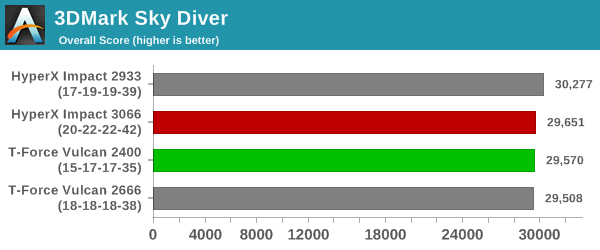
3DMark Sky Diver
The Sky Diver workload is meant for gaming notebooks and mid-range PCs, and uses DirectX 11 (feature level 11) to render frames at 1920 x 1080. The graph below presents the overall score for the workload across all the systems that are being compared.
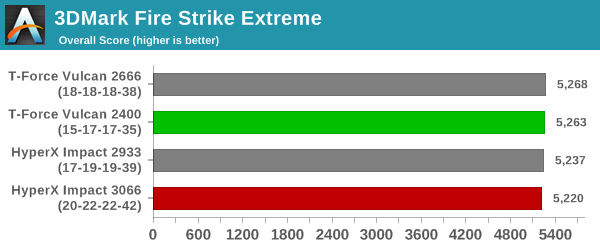
3DMark Fire Strike Extreme
The Fire Strike benchmark has three workloads. The base version is meant for high-performance gaming PCs. Similar to Sky Diver, it uses DirectX 11 (feature level 11) to render frames at 1920 x 1080. The Ultra version targets 4K gaming system, and renders at 3840 x 2160. However, we only deal with the Extreme version in our benchmarking - It renders at 2560 x 1440, and targets multi-GPU systems and overclocked PCs. The graph below presents the overall score for the Fire Strike Extreme benchmark across all the systems that are being compared.
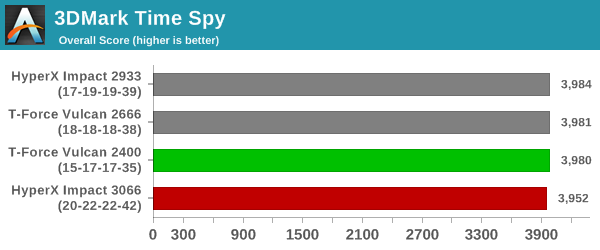
3DMark Time Spy
The Time Spy workload has two levels with different complexities. Both use DirectX 12 (feature level 11). However, the plain version targets high-performance gaming PCs with a 2560 x 1440 render resolution, while the Extreme version renders at 3840 x 2160 resolution. The graphs below present both numbers for all the systems that are being compared in this review.
| UL 3DMark - Time Spy Workloads | |||
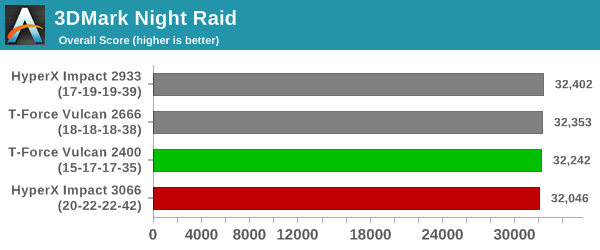
3DMark Night Raid
The Night Raid workload is a DirectX 12 benchmark test. It is less demanding than Time Spy, and is optimized for integrated graphics. The graph below presents the overall score in this workload for different system configurations.
The 'low-end' benchmarks - Sky Diver, Cloud Gate, and Ice Storm - show the DDR4-2933 configuration faring better. These benchmarks represent workloads that the GTX 1060 should have no problem with (they are actually meant for integrated graphics), and the CPU / DRAM characteristics can influence the scores easily. In the GPU-limited cases, we see no variations between the different tested configurations.


25 Comments
View All Comments
BedfordTim - Wednesday, November 28, 2018 - link
It would have been interesting to see some bargain basement memory in the comparison. Is there a specification below which we start to see a difference?goatfajitas - Wednesday, November 28, 2018 - link
I dunno, I think it gets the job done. The takeaway is the same as it has been for a decade... Higher bandwidth memory with higher latency provides very little actual performance improvements.qlum - Wednesday, November 28, 2018 - link
To add some qualifiers to what you said:In regards to cpu performance
on intel's core achitecture
IGP performance, AMD, certain memory limited workloads tell a different story.
goatfajitas - Wednesday, November 28, 2018 - link
"on intel's core achitecture"Agreed.
Flunk - Wednesday, November 28, 2018 - link
No, not really. The slowest and faster RAM here aren't that far off. What it really tells us is that minimal increases in RAM performance can bring noticeable performance improvements but only in memory-heavy applications. Which is pretty much exactly what you'd expect.goatfajitas - Wednesday, November 28, 2018 - link
"No, not really. The slowest and faster RAM here aren't that far off."That is what I said. Barely noticeable even in synthetic benchmarks.
BedfordTim - Wednesday, November 28, 2018 - link
There is a difference in two memory heavy applications. The RAM drive shows a ~20% benefit and one of the image processing benchmarks shows ~10% benefit.There will be a tiny number of people doing very specific applications who might notice the difference.
peterfares - Wednesday, November 28, 2018 - link
Not sure what other games it applies to but in Overwatch the RAM speed actually has a pretty significant impact on FPS when you start going very high FPS.https://www.reddit.com/r/Overwatch/comments/9srhx5...
Not sure what what speed the benefits stop, but improvements were still easily seen at 3200MHz.
Death666Angel - Wednesday, November 28, 2018 - link
It just seems a bit weird to test those speeds. G.Skill RipJaws SoDIMM DDR4-3200 CL18-18-18-43 are available in 8GB form for the same price as regular DDR4-3200 RAM and the 16GB variant is only slight more expensive (would be 5th in the price ranking with regular DDR4-3200 RAM). Is that just a weird German price thing? I was even considering buying them with an adapter just so I can have some more potential usability for the future. :Ddeil - Wednesday, November 28, 2018 - link
IMHO small things that does not even make the cpu leave lower power state happens faster, page loading, folder browsing etc...might be just bias or simple "better timings" that was also the case for me. Still I feel something different in day-to-day stuff.