The Xeon Entry Quad-Core CPU Review: Xeon E-2174G, E-2134, and E-2104G Tested
by Ian Cutress on March 11, 2019 10:30 AM EST- Posted in
- CPUs
- Xeon
- Enterprise CPUs
- Coffee Lake
- Xeon E
- C246
CPU Performance: System Tests
Our System Test section focuses significantly on real-world testing, user experience, with a slight nod to throughput. In this section we cover application loading time, image processing, simple scientific physics, emulation, neural simulation, optimized compute, and 3D model development, with a combination of readily available and custom software. For some of these tests, the bigger suites such as PCMark do cover them (we publish those values in our office section), although multiple perspectives is always beneficial. In all our tests we will explain in-depth what is being tested, and how we are testing.
All of our benchmark results can also be found in our benchmark engine, Bench.
Application Load: GIMP 2.10.4
One of the most important aspects about user experience and workflow is how fast does a system respond. A good test of this is to see how long it takes for an application to load. Most applications these days, when on an SSD, load fairly instantly, however some office tools require asset pre-loading before being available. Most operating systems employ caching as well, so when certain software is loaded repeatedly (web browser, office tools), then can be initialized much quicker.
In our last suite, we tested how long it took to load a large PDF in Adobe Acrobat. Unfortunately this test was a nightmare to program for, and didn’t transfer over to Win10 RS3 easily. In the meantime we discovered an application that can automate this test, and we put it up against GIMP, a popular free open-source online photo editing tool, and the major alternative to Adobe Photoshop. We set it to load a large 50MB design template, and perform the load 10 times with 10 seconds in-between each. Due to caching, the first 3-5 results are often slower than the rest, and time to cache can be inconsistent, we take the average of the last five results to show CPU processing on cached loading.
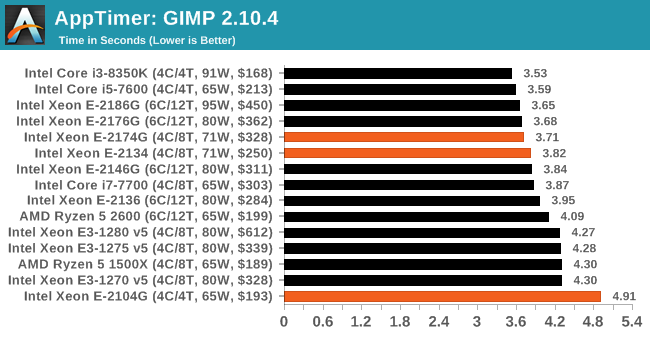
For short bursty workloads, most processors are within the same sort of margins. The slower E-2104G takes a bit longer, however.
FCAT: Image Processing
The FCAT software was developed to help detect microstuttering, dropped frames, and run frames in graphics benchmarks when two accelerators were paired together to render a scene. Due to game engines and graphics drivers, not all GPU combinations performed ideally, which led to this software fixing colors to each rendered frame and dynamic raw recording of the data using a video capture device.
The FCAT software takes that recorded video, which in our case is 90 seconds of a 1440p run of Rise of the Tomb Raider, and processes that color data into frame time data so the system can plot an ‘observed’ frame rate, and correlate that to the power consumption of the accelerators. This test, by virtue of how quickly it was put together, is single threaded. We run the process and report the time to completion.
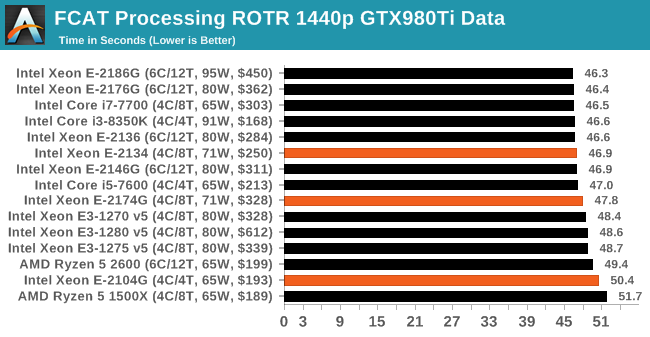
With a longer sustained single thread workload, there's not much in most of the processors selected.
3D Particle Movement v2.1: Brownian Motion
Our 3DPM test is a custom built benchmark designed to simulate six different particle movement algorithms of points in a 3D space. The algorithms were developed as part of my PhD., and while ultimately perform best on a GPU, provide a good idea on how instruction streams are interpreted by different microarchitectures.
A key part of the algorithms is the random number generation – we use relatively fast generation which ends up implementing dependency chains in the code. The upgrade over the naïve first version of this code solved for false sharing in the caches, a major bottleneck. We are also looking at AVX2 and AVX512 versions of this benchmark for future reviews.
For this test, we run a stock particle set over the six algorithms for 20 seconds apiece, with 10 second pauses, and report the total rate of particle movement, in millions of operations (movements) per second. We have a non-AVX version and an AVX version, with the latter implementing AVX512 and AVX2 where possible.
3DPM v2.1 can be downloaded from our server: 3DPMv2.1.rar (13.0 MB)
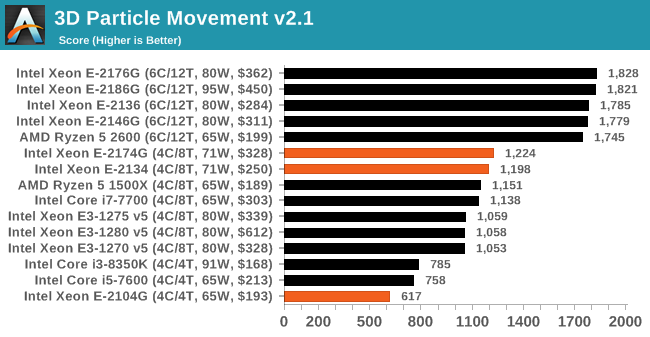
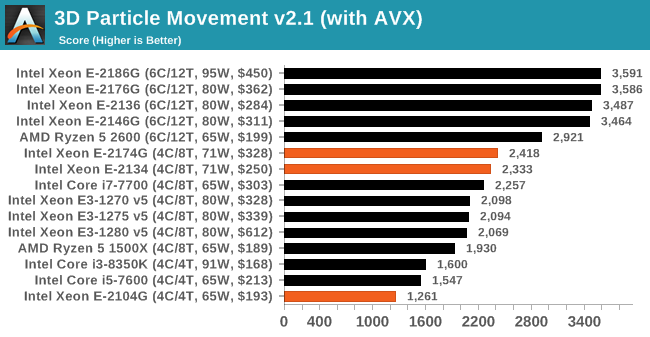
All the Xeon E-2100 family has AVX2, which gives a doubling of performance over non-AVX code.
Dolphin 5.0: Console Emulation
One of the popular requested tests in our suite is to do with console emulation. Being able to pick up a game from an older system and run it as expected depends on the overhead of the emulator: it takes a significantly more powerful x86 system to be able to accurately emulate an older non-x86 console, especially if code for that console was made to abuse certain physical bugs in the hardware.
For our test, we use the popular Dolphin emulation software, and run a compute project through it to determine how close to a standard console system our processors can emulate. In this test, a Nintendo Wii would take around 1050 seconds.
The latest version of Dolphin can be downloaded from https://dolphin-emu.org/
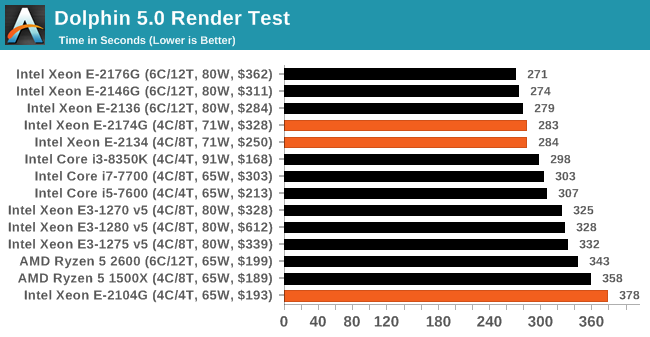
Similar to the GIMP loading test, the higher valued parts get similar scores, whereas the E-2104G lags behind.
DigiCortex 1.20: Sea Slug Brain Simulation
This benchmark was originally designed for simulation and visualization of neuron and synapse activity, as is commonly found in the brain. The software comes with a variety of benchmark modes, and we take the small benchmark which runs a 32k neuron / 1.8B synapse simulation, equivalent to a Sea Slug.
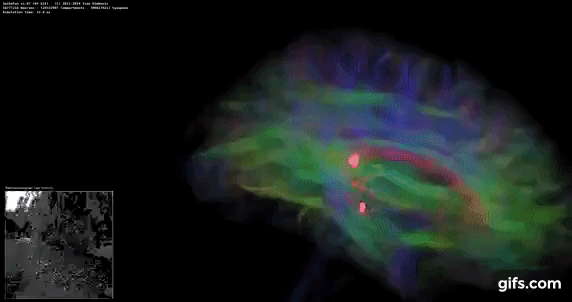
Example of a 2.1B neuron simulation
We report the results as the ability to simulate the data as a fraction of real-time, so anything above a ‘one’ is suitable for real-time work. Out of the two modes, a ‘non-firing’ mode which is DRAM heavy and a ‘firing’ mode which has CPU work, we choose the latter. Despite this, the benchmark is still affected by DRAM speed a fair amount.
DigiCortex can be downloaded from http://www.digicortex.net/
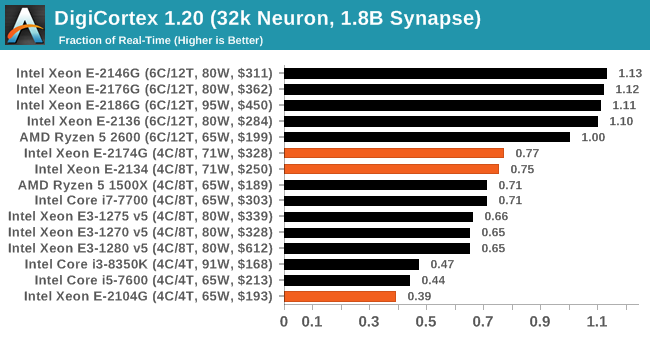
DigiCortex does well with additional threads here, showing an almost 2x jump when enabling hyperthreading.
y-Cruncher v0.7.6: Microarchitecture Optimized Compute
I’ve known about y-Cruncher for a while, as a tool to help compute various mathematical constants, but it wasn’t until I began talking with its developer, Alex Yee, a researcher from NWU and now software optimization developer, that I realized that he has optimized the software like crazy to get the best performance. Naturally, any simulation that can take 20+ days can benefit from a 1% performance increase! Alex started y-cruncher as a high-school project, but it is now at a state where Alex is keeping it up to date to take advantage of the latest instruction sets before they are even made available in hardware.
For our test we run y-cruncher v0.7.6 through all the different optimized variants of the binary, single threaded and multi-threaded, including the AVX-512 optimized binaries. The test is to calculate 250m digits of Pi, and we use the single threaded and multi-threaded versions of this test.
Users can download y-cruncher from Alex’s website: http://www.numberworld.org/y-cruncher/
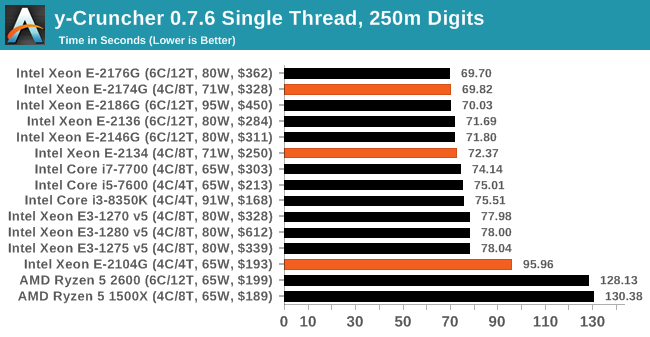
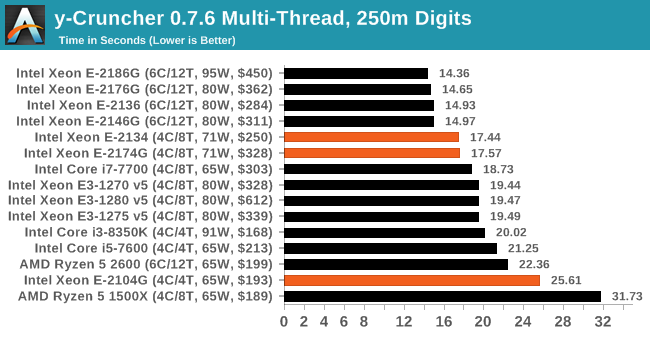
In single thread mode, we again see the jump from the slower E-2104G to the two faster parts. Given both of the faster parts have similar all-core turbos, we see that in MT mode they perfom equally.
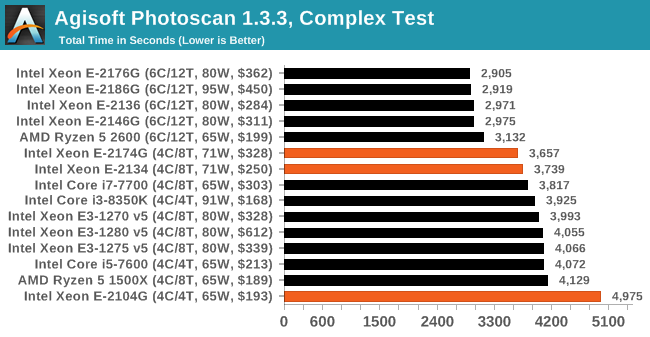
Agisoft Photoscan 1.3.3: 2D Image to 3D Model Conversion
One of the ISVs that we have worked with for a number of years is Agisoft, who develop software called PhotoScan that transforms a number of 2D images into a 3D model. This is an important tool in model development and archiving, and relies on a number of single threaded and multi-threaded algorithms to go from one side of the computation to the other.
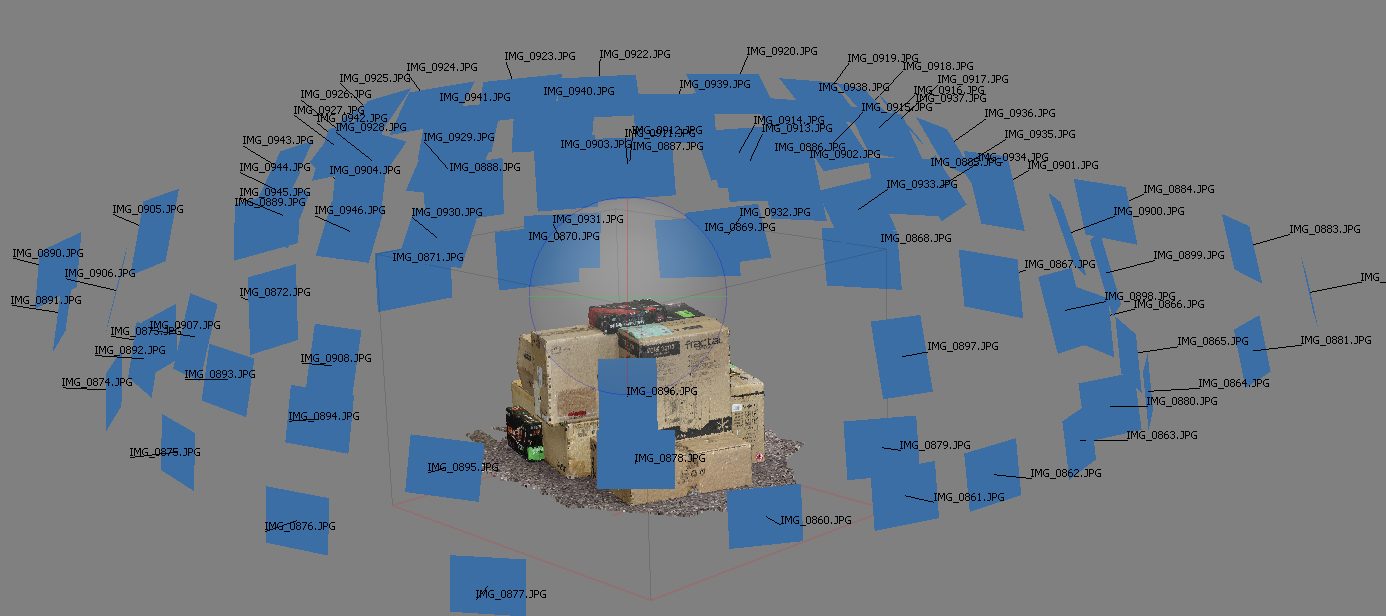
In our test, we take v1.3.3 of the software with a good sized data set of 84 x 18 megapixel photos and push it through a reasonably fast variant of the algorithms, but is still more stringent than our 2017 test. We report the total time to complete the process.
Agisoft’s Photoscan website can be found here: http://www.agisoft.com/


29 Comments
View All Comments
dgingeri - Monday, March 11, 2019 - link
It would be interesting to get comparative data on the 2124G and the 2126G to see if 4/8 or 6/6 would perform better.dgingeri - Monday, March 11, 2019 - link
er, sorry, meant the 2144G, not the 2124G.Stuka87 - Wednesday, March 13, 2019 - link
In my experience, real cores perform better than hyper-threaded cores. So I would be on the 6/6.yankeeDDL - Monday, March 11, 2019 - link
Is it me of the $328 xeon often loses (and sometimes by a sizable margin) to the $199 Ryzen 2600?RSAUser - Monday, March 11, 2019 - link
Definitely, but here the power envelope is important for the test, which Anandtech doesn't seem to give. It's quite worrisome how most of those Xeons are operating outside of their power envelope, that E-2174G that you are referring to is pulling 85W for a rated 71W, so Intel gives a P2 power limit. Why bother with the normal TDP then? The 2600 seems to be owning price/performance and TDP/performance. Question there is EEC memory support, and the guarantee/testing including with Xeons. That's why I mentioned including TR in the benchmarks, or at least the 2700X.This is going to be interesting when AMD releases their 7nm products.
SaturnusDK - Monday, March 11, 2019 - link
All AMD CPUs based on Zen or Zen+ supports EEC RAM. It's up to the MB manufacturer if they have included the support on their MBs. For any workstation build where you don't need the memory bandwidth or superior number of PCIe lanes the TR series offer, you'd use the Ryzen Pro series, not the consumer desktop series.mode_13h - Monday, March 11, 2019 - link
I seem to recall reading that at least some of the Zen-based APUs are lacking ECC-support. I'd love to be proven wrong...notashill - Tuesday, March 12, 2019 - link
AMD has directly confirmed that all Raven Ridge APUs support ECC.https://forums.anandtech.com/threads/amd-ama-start...
Yorgos - Sunday, March 17, 2019 - link
You seem to know nothing.ondma - Monday, March 11, 2019 - link
The 2600 goes over its TDP as well. It actually goes over its TDP by 20%, pretty much the same percentage as the hex core Intel cpus. And as usual, Anand is using an antiquated dgpu for the gaming tests.