The Xeon Entry Quad-Core CPU Review: Xeon E-2174G, E-2134, and E-2104G Tested
by Ian Cutress on March 11, 2019 10:30 AM EST- Posted in
- CPUs
- Xeon
- Enterprise CPUs
- Coffee Lake
- Xeon E
- C246
CPU Performance: Rendering Tests
Rendering is often a key target for processor workloads, lending itself to a professional environment. It comes in different formats as well, from 3D rendering through rasterization, such as games, or by ray tracing, and invokes the ability of the software to manage meshes, textures, collisions, aliasing, physics (in animations), and discarding unnecessary work. Most renderers offer CPU code paths, while a few use GPUs and select environments use FPGAs or dedicated ASICs. For big studios however, CPUs are still the hardware of choice.
All of our benchmark results can also be found in our benchmark engine, Bench.
Corona 1.3: Performance Render
An advanced performance based renderer for software such as 3ds Max and Cinema 4D, the Corona benchmark renders a generated scene as a standard under its 1.3 software version. Normally the GUI implementation of the benchmark shows the scene being built, and allows the user to upload the result as a ‘time to complete’.
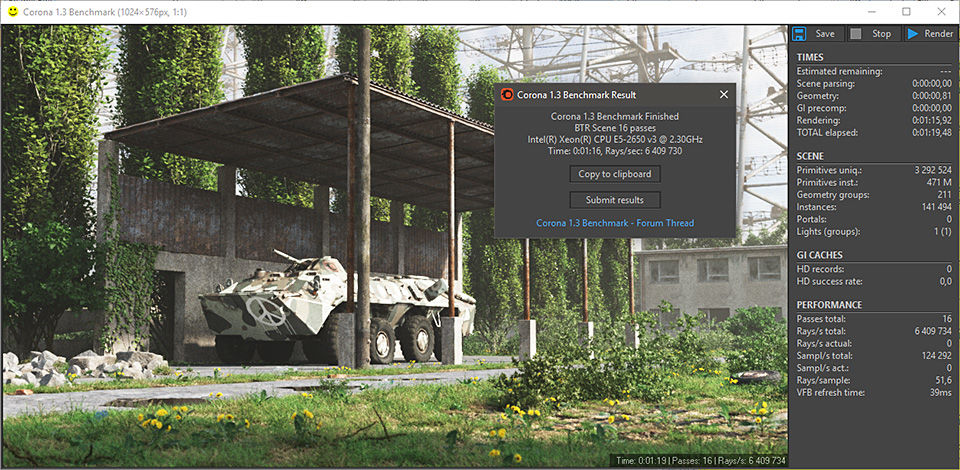
We got in contact with the developer who gave us a command line version of the benchmark that does a direct output of results. Rather than reporting time, we report the average number of rays per second across six runs, as the performance scaling of a result per unit time is typically visually easier to understand.
The Corona benchmark website can be found at https://corona-renderer.com/benchmark
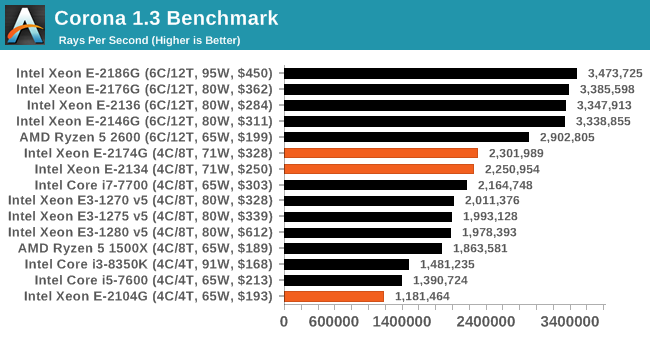
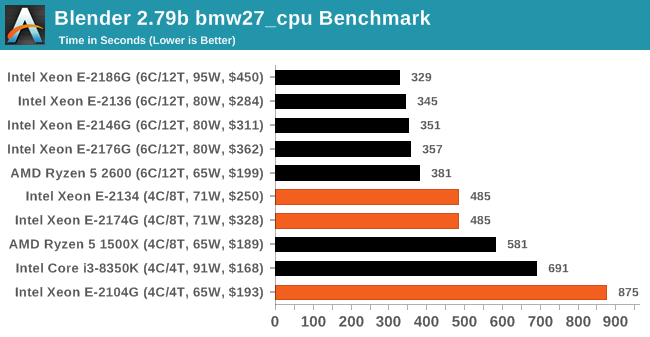
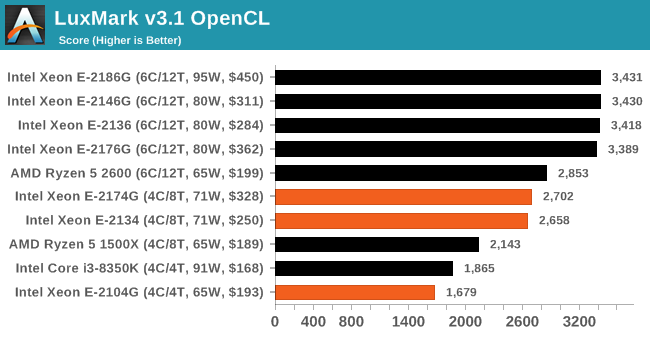
With the rendering tests, all our quad-core Xeon E processors lose out to the respective cheaper Ryzen parts.
Blender 2.79b: 3D Creation Suite
A high profile rendering tool, Blender is open-source allowing for massive amounts of configurability, and is used by a number of high-profile animation studios worldwide. The organization recently released a Blender benchmark package, a couple of weeks after we had narrowed our Blender test for our new suite, however their test can take over an hour. For our results, we run one of the sub-tests in that suite through the command line - a standard ‘bmw27’ scene in CPU only mode, and measure the time to complete the render.
Blender can be downloaded at https://www.blender.org/download/
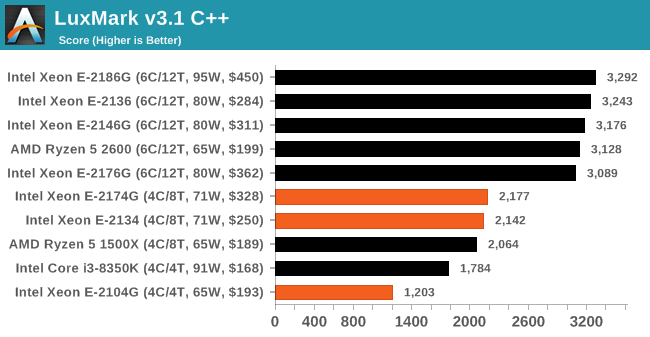
LuxMark v3.1: LuxRender via Different Code Paths
As stated at the top, there are many different ways to process rendering data: CPU, GPU, Accelerator, and others. On top of that, there are many frameworks and APIs in which to program, depending on how the software will be used. LuxMark, a benchmark developed using the LuxRender engine, offers several different scenes and APIs.
In our test, we run the simple ‘Ball’ scene on both the C++ and OpenCL code paths, but in CPU mode. This scene starts with a rough render and slowly improves the quality over two minutes, giving a final result in what is essentially an average ‘kilorays per second’.
POV-Ray 3.7.1: Ray Tracing
The Persistence of Vision ray tracing engine is another well-known benchmarking tool, which was in a state of relative hibernation until AMD released its Zen processors, to which suddenly both Intel and AMD were submitting code to the main branch of the open source project. For our test, we use the built-in benchmark for all-cores, called from the command line.
POV-Ray can be downloaded from http://www.povray.org/
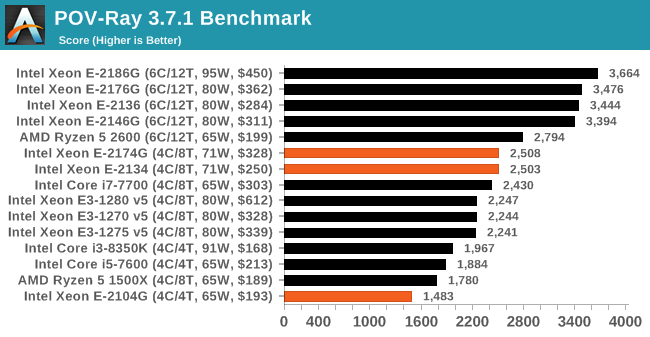
The much cheaper Ryzen 5 2600 here gets a good perf/$ boost over any of the quad-core Xeon E processors, and with the right system, can have ECC enabled.


29 Comments
View All Comments
dgingeri - Monday, March 11, 2019 - link
It would be interesting to get comparative data on the 2124G and the 2126G to see if 4/8 or 6/6 would perform better.dgingeri - Monday, March 11, 2019 - link
er, sorry, meant the 2144G, not the 2124G.Stuka87 - Wednesday, March 13, 2019 - link
In my experience, real cores perform better than hyper-threaded cores. So I would be on the 6/6.yankeeDDL - Monday, March 11, 2019 - link
Is it me of the $328 xeon often loses (and sometimes by a sizable margin) to the $199 Ryzen 2600?RSAUser - Monday, March 11, 2019 - link
Definitely, but here the power envelope is important for the test, which Anandtech doesn't seem to give. It's quite worrisome how most of those Xeons are operating outside of their power envelope, that E-2174G that you are referring to is pulling 85W for a rated 71W, so Intel gives a P2 power limit. Why bother with the normal TDP then? The 2600 seems to be owning price/performance and TDP/performance. Question there is EEC memory support, and the guarantee/testing including with Xeons. That's why I mentioned including TR in the benchmarks, or at least the 2700X.This is going to be interesting when AMD releases their 7nm products.
SaturnusDK - Monday, March 11, 2019 - link
All AMD CPUs based on Zen or Zen+ supports EEC RAM. It's up to the MB manufacturer if they have included the support on their MBs. For any workstation build where you don't need the memory bandwidth or superior number of PCIe lanes the TR series offer, you'd use the Ryzen Pro series, not the consumer desktop series.mode_13h - Monday, March 11, 2019 - link
I seem to recall reading that at least some of the Zen-based APUs are lacking ECC-support. I'd love to be proven wrong...notashill - Tuesday, March 12, 2019 - link
AMD has directly confirmed that all Raven Ridge APUs support ECC.https://forums.anandtech.com/threads/amd-ama-start...
Yorgos - Sunday, March 17, 2019 - link
You seem to know nothing.ondma - Monday, March 11, 2019 - link
The 2600 goes over its TDP as well. It actually goes over its TDP by 20%, pretty much the same percentage as the hex core Intel cpus. And as usual, Anand is using an antiquated dgpu for the gaming tests.